After an eventful May, Philadelphia’s November General Election will be a lot quieter. The Democrats will almost certainly win every contested race (I’ll look at the interesting District races later), as they do every year.
But the race for the seven Council At Large seats could be more interesting than you think. That’s because the city Charter states that no party can nominate more than five candidates. Historically, this has meant the five Democratic nominees win easily, and two of the five Republicans win. But there’s no reason that the two non-Democrats have to be Republicans, and seven third party or independent candidates have filed petitions to get on the ballot this time around. This includes two candidates from the Working Families Party, which has fielded candidates for the first time.
Before 2015, these candidates wouldn’t have had a shot. But 2015 saw the first non-trivial challenge of the millenium by a third party candidate, with Philadelphia Party candidate Andrew Stober receiving about half the votes of the winning Republican. And the progressives are likely hoping to seize on the success of Larry Krasner who won as a Democrat, but from the progressive wing.
How would it happen? The only plausible way is for Democrats to spend their votes on third party candidates. This would probably be the right strategy for many Philadelphian’s preference sets, using the framework I laid out around Bullet Voting: the Democrats will 100% win, so voting for them has no impact on the state of the world. It’s optimal, then, to spend your votes on candidates with non-zero, non-100% chances. So a progressive might cast votes for all the third party candidates they prefer to Republicans, or the Republican they prefer over others. (Yeah, I know, this logic all changes if every Philadelphian starts thinking this way, and Democrats are then in trouble. I don’t have that kind of readership. The Democrats will win, trust me.)
So, could it really happen? Could enough Democrats strategically cast votes for third party candidates? What would it take? Here’s some data from the recent past.
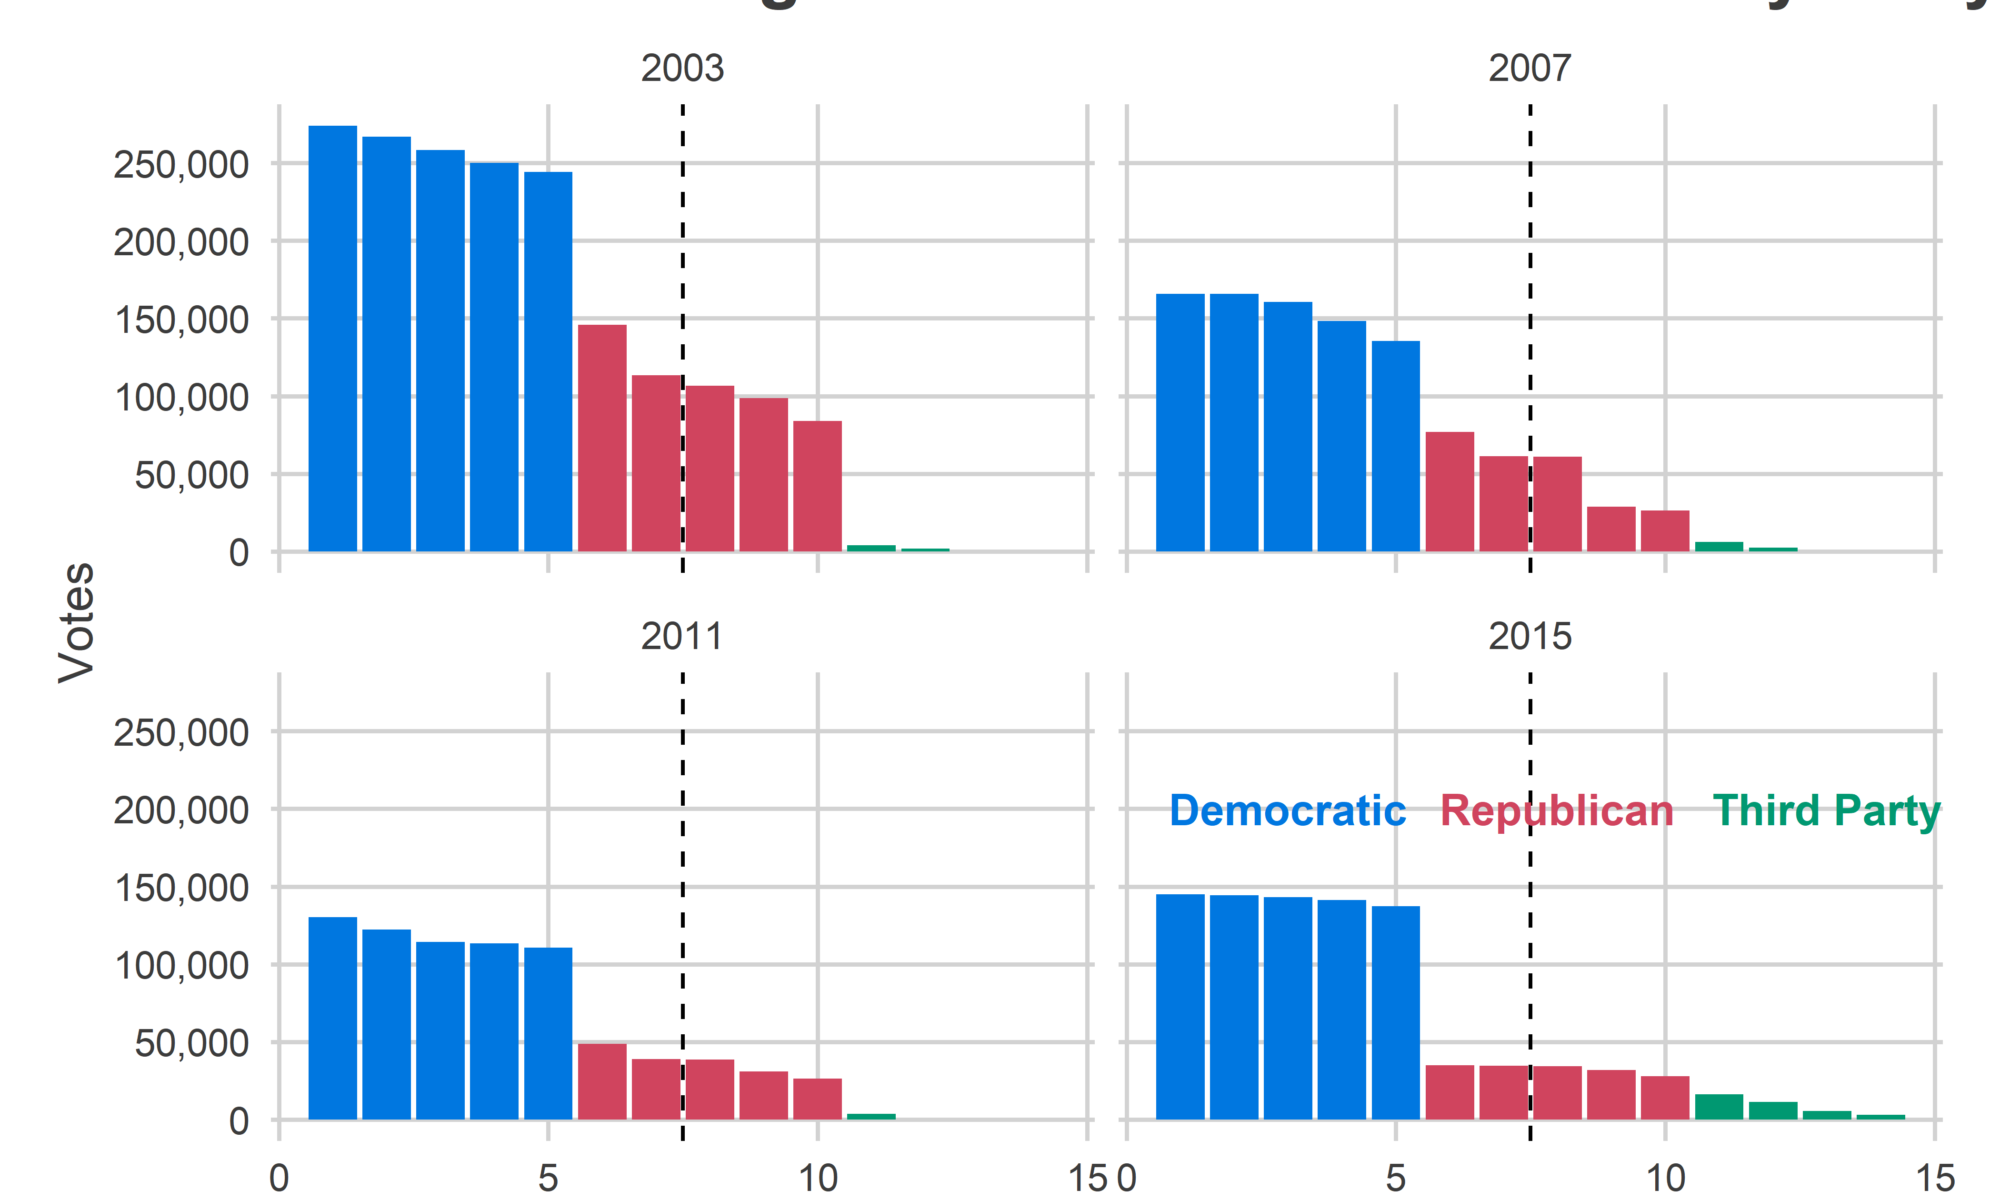
Third Parties didn’t show, until 2015
View code
library(tidyverse)
library(knitr)
library(kableExtra)

df <- safe_load("../../data/processed_data/df_all_2019_07_09.Rda")

df <- df %>%
  mutate(
    PARTY = ifelse(PARTY == "DEMOCRAT", "DEMOCRATIC", PARTY),
    PARTY = gsub(" PARTY$", "", PARTY)
  )

df_council <- df %>%
  filter(OFFICE %in% c("COUNCIL AT LARGE", "COUNCIL AT-LARGE"), CANDIDATE != "Write In") %>%
  group_by(CANDIDATE, PARTY, WARD19, DIV19, year, election) %>%
  summarise(votes = sum(VOTES)) %>%
  ungroup()

df_total <- df_council %>%
  group_by(CANDIDATE, PARTY, year, election) %>%
  summarise(votes = sum(votes)) %>%
  ungroup()

df_total <- df_total %>%
  mutate(
    CANDIDATE = format_name(CANDIDATE)
  ) %>%
  group_by(year, election) %>%
  mutate(
    rank = rank(desc(votes)),
    pvote = votes/sum(votes)
  ) %>%
  ungroup()

df_total$party_label <- format_name(df_total$PARTY)
df_total$party_label[!df_total$party_label %in% c("Democratic", "Republican")] <- "Third Party"

colors <- list(
  Democratic=strong_blue,
  Republican=strong_red,
  `Third Party`=strong_green
)

ggplot(
  df_total %>% filter(election=="general"),
  aes(x=rank, y=votes)
) +
  geom_bar(aes(fill=party_label), stat='identity') +
  facet_wrap(~year) +
  geom_vline(xintercept=7.5, linetype="dashed") +
  theme_sixtysix() +
  xlab("Rank") + ylab("Percent of Vote")+
  scale_y_continuous("Votes", labels=scales::comma, breaks=seq(0,300e3,50e3)) +
  scale_fill_manual(
    "", values=unlist(colors), guide=FALSE
  ) +
  scale_color_manual(
    "", values=unlist(colors),  guide=FALSE
  ) +
  geom_text(
    data=data.frame(
      rank=c(3,8,13), votes=200e3,
      party_label=c("Democratic", "Republican", "Third Party"),
      year="2015"
    ),
    aes(label=party_label, color=party_label),
    fontface="bold"
  ) +
  ggtitle("Council At Large General Election Results by Party")
The 2015 election was the first time third party candidates made a stand. Up through 2011, their vote totals don’t break 0.6%, but the 1.8% and 1.2% received by Andrew Stober (Philadelphia Party) and Kristin Combs (Green Party) in 2015 was about 1/2 and 1/3 of the votes needed to win, respectively.
View code
library(knitr)
library(kableExtra)

rank_table <- df_total %>%
  filter(election=="general") %>%
  select(-party_label, -election) %>%
  mutate(
    PARTY = format_name(PARTY),
    pvote=sprintf("%0.1f%%", 100*pvote),
    votes=scales::comma(votes)
  ) %>%
  rename(
    Candidate = CANDIDATE,
    Party = PARTY,
    'Pct Vote' = pvote,
    Votes = votes
  ) %>%
  gather("key", "value", -year, -rank) %>%
  unite("key", year, key, sep = " ") %>%
  spread(key,value, fill = "--")

rank_kable <- kable(
  rank_table,
    caption="Recent At Large General Elections",
    align='l',
    col.names=c("Rank", rep(c("Candidate", "Party", "% Vote", "Votes"), times=4)),
    padding = "4in"
  ) %>%
    column_spec(2, width = "1em") %>%
    add_header_above(
      c(" " = 1, "2003" = 4, "2007" = 4, "2011" =4, "2015" = 4)
    ) %>%
    kable_styling() %>%
    scroll_box(width="100%")

rank_kable| Rank | Candidate | Party | % Vote | Votes | Candidate | Party | % Vote | Votes | Candidate | Party | % Vote | Votes | Candidate | Party | % Vote | Votes |
|---|---|---|---|---|---|---|---|---|---|---|---|---|---|---|---|---|
| 1 | James F Kenney | Democratic | 14.8% | 274,053 | Bill Green | Democratic | 16.0% | 165,796 | Bill Green | Democratic | 16.8% | 130,403 | Helen Gym | Democratic | 15.9% | 145,087 |
| 2 | David Cohen | Democratic | 14.4% | 266,994 | James F Kenney | Democratic | 16.0% | 165,764 | James F Kenney | Democratic | 15.7% | 122,384 | Derek S Green | Democratic | 15.8% | 144,337 |
| 3 | W Wilson Goode Jr | Democratic | 14.0% | 258,423 | W Wilson Goode Jr | Democratic | 15.5% | 160,531 | Blondell Reynolds Brown | Democratic | 14.7% | 114,396 | Allan Domb | Democratic | 15.7% | 143,265 |
| 4 | Juan F Ramos | Democratic | 13.5% | 250,149 | Blondell Reynolds Brown | Democratic | 14.3% | 148,236 | W Wilson Goode Jr | Democratic | 14.6% | 113,431 | Blondell Reynolds Brown | Democratic | 15.5% | 141,368 |
| 5 | Blondell Reynolds Brown | Democratic | 13.2% | 244,096 | William K Greenlee | Democratic | 13.0% | 135,419 | William K Greenlee | Democratic | 14.2% | 110,544 | William K Greenlee | Democratic | 15.1% | 137,315 |
| 6 | Frank Rizzo | Republican | 7.9% | 145,852 | Frank Rizzo | Republican | 7.4% | 76,937 | Dennis M O Brien | Republican | 6.3% | 48,675 | David Oh | Republican | 3.8% | 34,887 |
| 7 | Jack Kelly | Republican | 6.1% | 113,298 | Jack Kelly | Republican | 5.9% | 61,239 | David H Oh | Republican | 5.0% | 38,835 | Al Taubenberger | Republican | 3.8% | 34,711 |
| 8 | Jamie Mc Dermott | Republican | 5.8% | 106,544 | David Oh | Republican | 5.9% | 61,117 | Al Taubenberger | Republican | 5.0% | 38,632 | Dennis M O Brien | Republican | 3.8% | 34,324 |
| 9 | David Oh | Republican | 5.3% | 98,687 | Patricia A Mattern | Republican | 2.8% | 28,729 | Joseph M McColgan | Republican | 4.0% | 30,936 | Daniel Tinney | Republican | 3.5% | 31,863 |
| 10 | David P Hardy | Republican | 4.5% | 83,965 | Phil Kerwick | Republican | 2.5% | 26,362 | Michael W Untermeyer | Republican | 3.4% | 26,336 | Terry Tracy | Republican | 3.1% | 28,050 |
| 11 | Will Mega | Education | 0.2% | 3,854 | Jacinth Brown Roberts | Green | 0.6% | 6,043 | Richard Johnson | Independent | 0.5% | 3,627 | Andrew C Stober | Philadelphia | 1.8% | 16,301 |
| 12 | Hilda Cuzco | Socialist Workers | 0.1% | 1,823 | Osborne Hart | Socialist Workers | 0.2% | 2,284 | – | – | – | – | Kristin Combs | Green | 1.2% | 11,366 |
| 13 | – | – | – | – | – | – | – | – | – | – | – | – | Sheila E Armstrong | Independent | 0.6% | 5,466 |
| 14 | – | – | – | – | – | – | – | – | – | – | – | – | John Staggs | Socialist Workers | 0.3% | 3,028 |
The raw vote counts needed to win, and even the percentages, bounce around quite a bit. How many votes will it take to win this time? First, how many votes will be cast?
View code
turnout <- df_total %>%
  group_by(year, election) %>%
  summarise(votes = sum(votes))

cycles <- c("President", "DA", "Governor", "Mayor")
get_cycle <- function(year) cycles[(asnum(year) %% 4)+1]

ggplot(
  turnout %>%
    filter(
      asnum(year) %% 4 == 3
    ),
  aes(x=year, y=votes, color=election)
) +
  geom_point(size=2) +
  geom_line(aes(group=election)) +
  expand_limits(y=0) +
  theme_sixtysix() +
  scale_y_continuous("", labels = scales::comma) +
  xlab("")+
  scale_color_manual(
    "",
    values=c(general=strong_green, primary=strong_purple),
    guide=FALSE
  ) +
  annotate(
    "text",
    x = '2015',
    y=c(500e3, 1100e3),
    label=c("Primary", "General"),
    color=c(strong_purple, strong_green),
    fontface="bold"
  ) +
  ggtitle("Votes cast for Council At Large")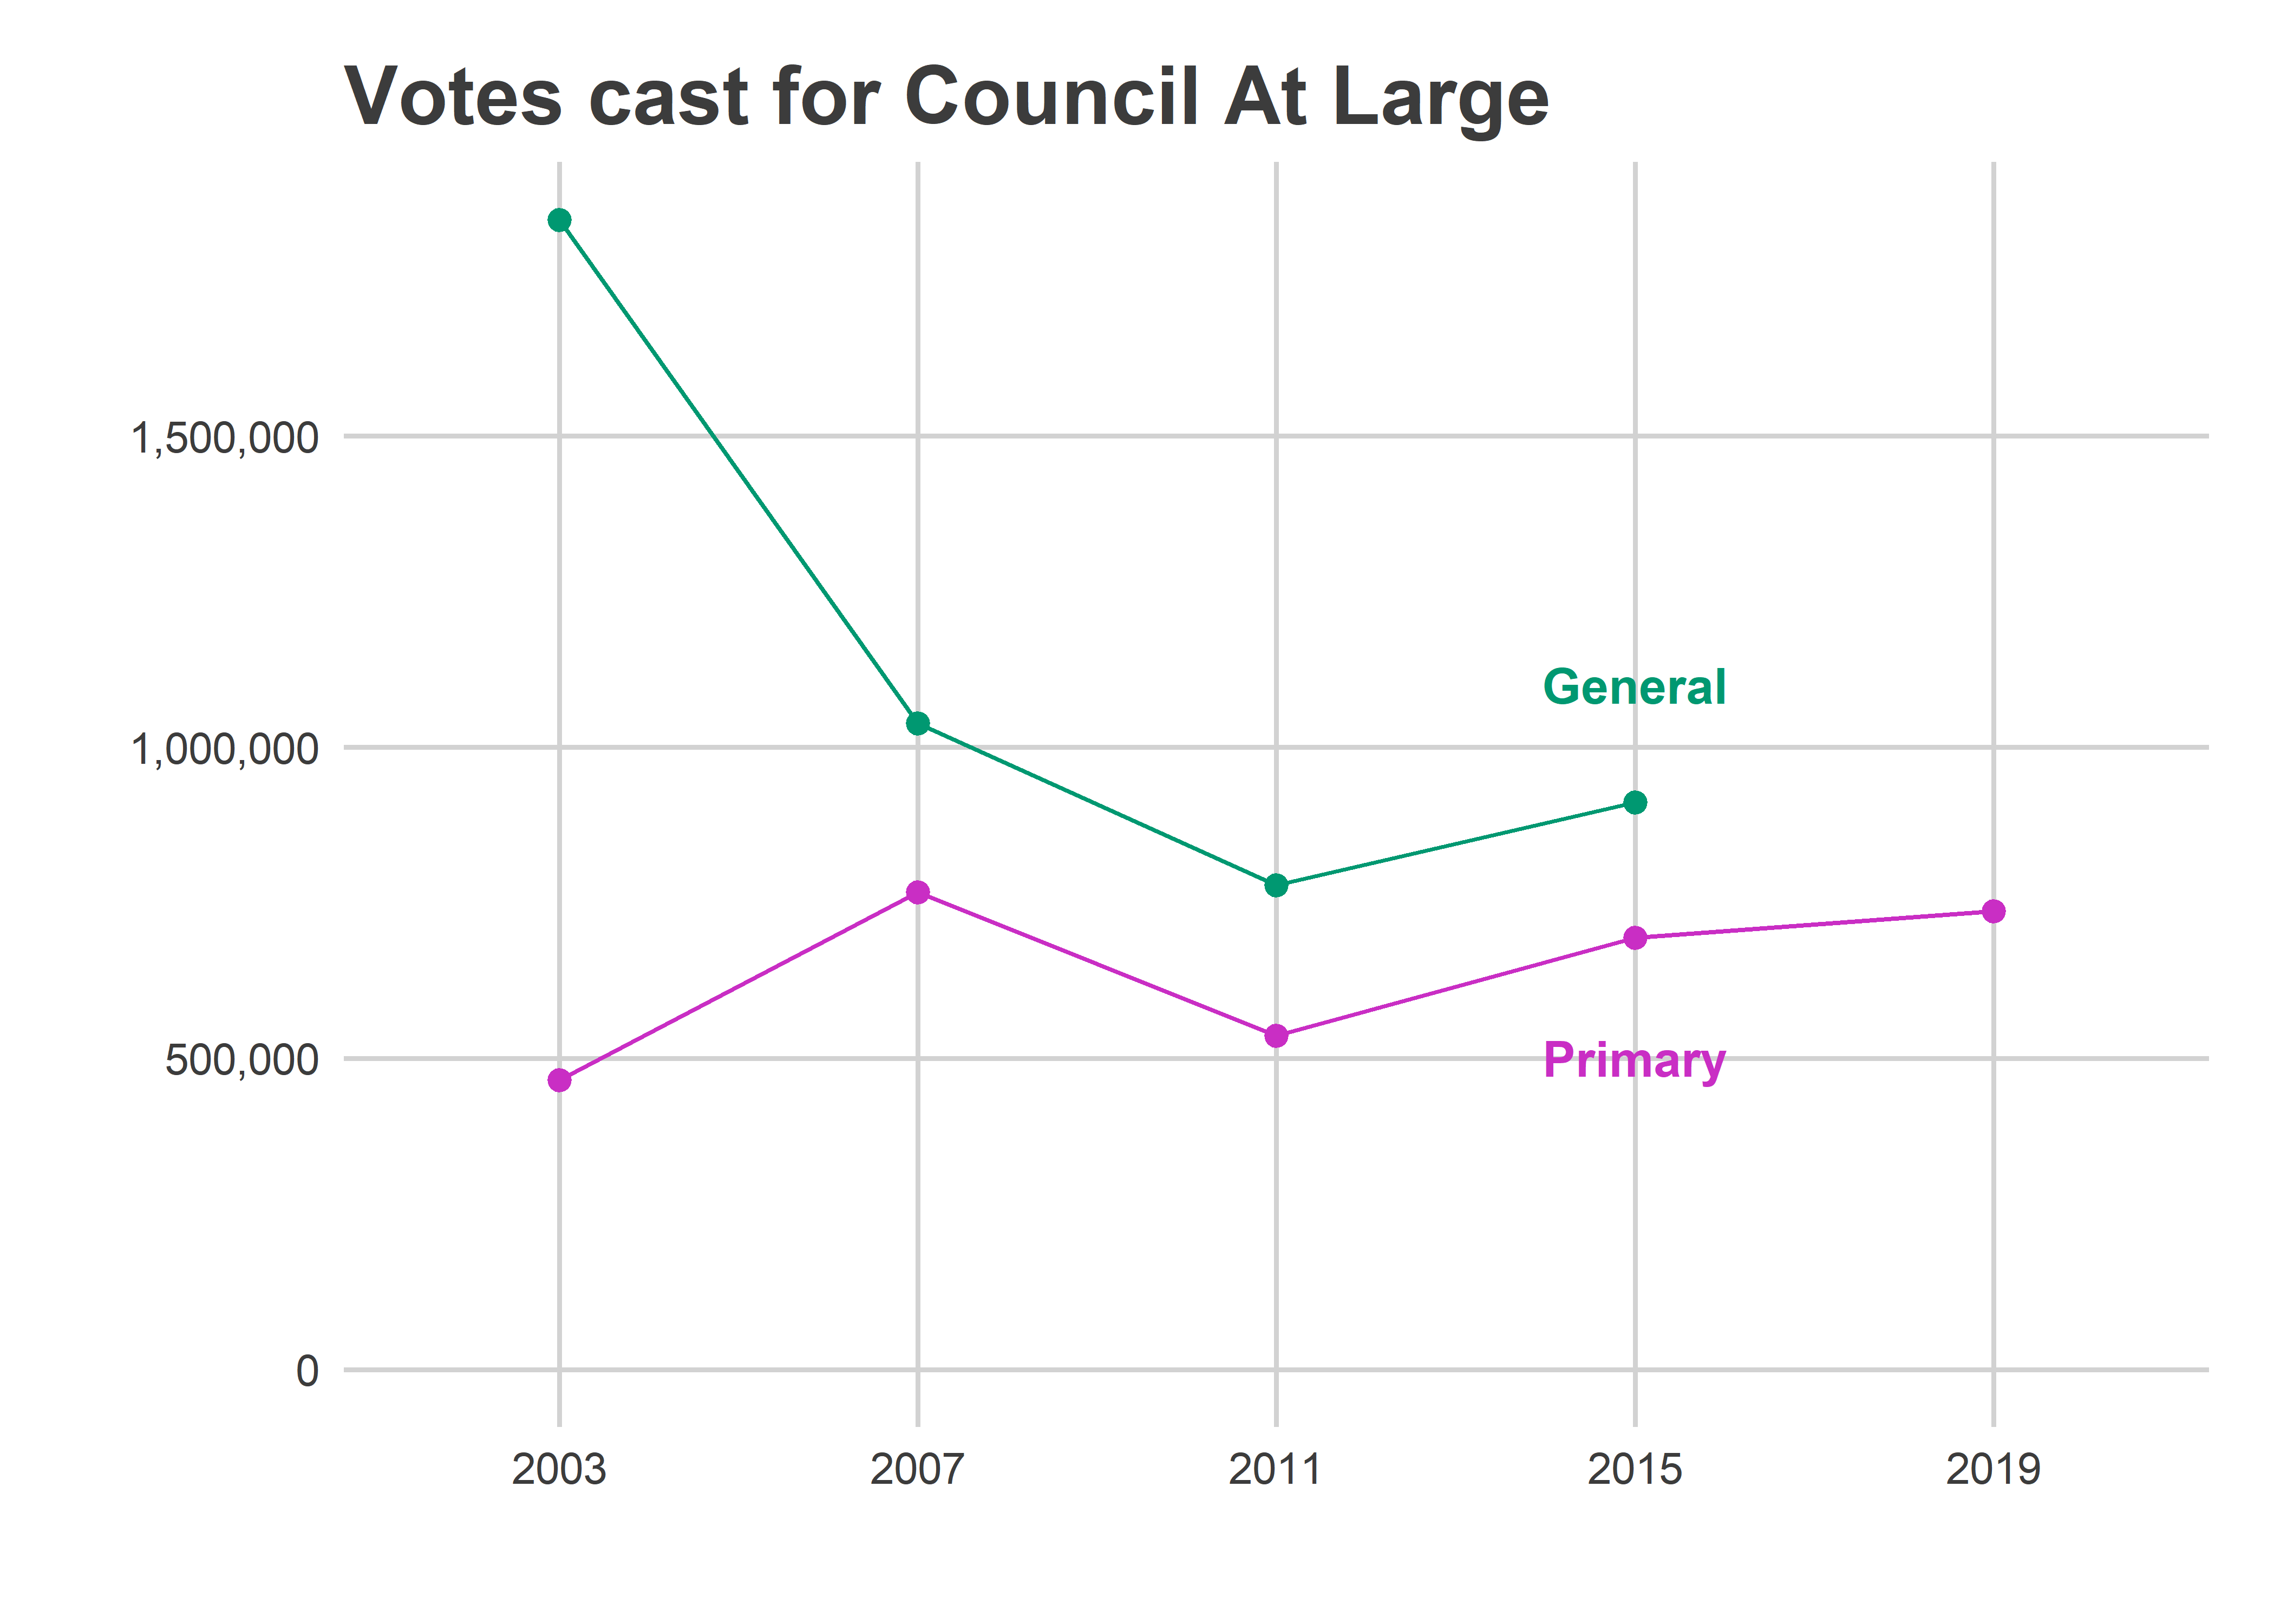
How many votes will be cast in November? The General Election has had about 250,000 more votes cast than the Primary in each of the last three elections. (Notice that votes cast for Council At Large is much higher than the number of voters, since voters can vote for multiple candidates). 2003 had a uniquely competitive General (with Sam Katz challenging John Street), explaining the unique gap that year; that won’t happen this time. We blew past my projections for turnout this past May, with unprecedented excitement for an incumbent-Mayor primary; my hunch is that only a portion of that surge will survive in November, and we’ll see General votes in the 780-800K range.
The At Large win number
How many votes will it take to win the seventh place seat? The five Democrats are guaranteed to win. So the question becomes, how many votes will the second-place Republican get? History can give us a hint. Here are the votes received by Republicans in recent Primary and General Elections, for the topline office and for Council At Large.
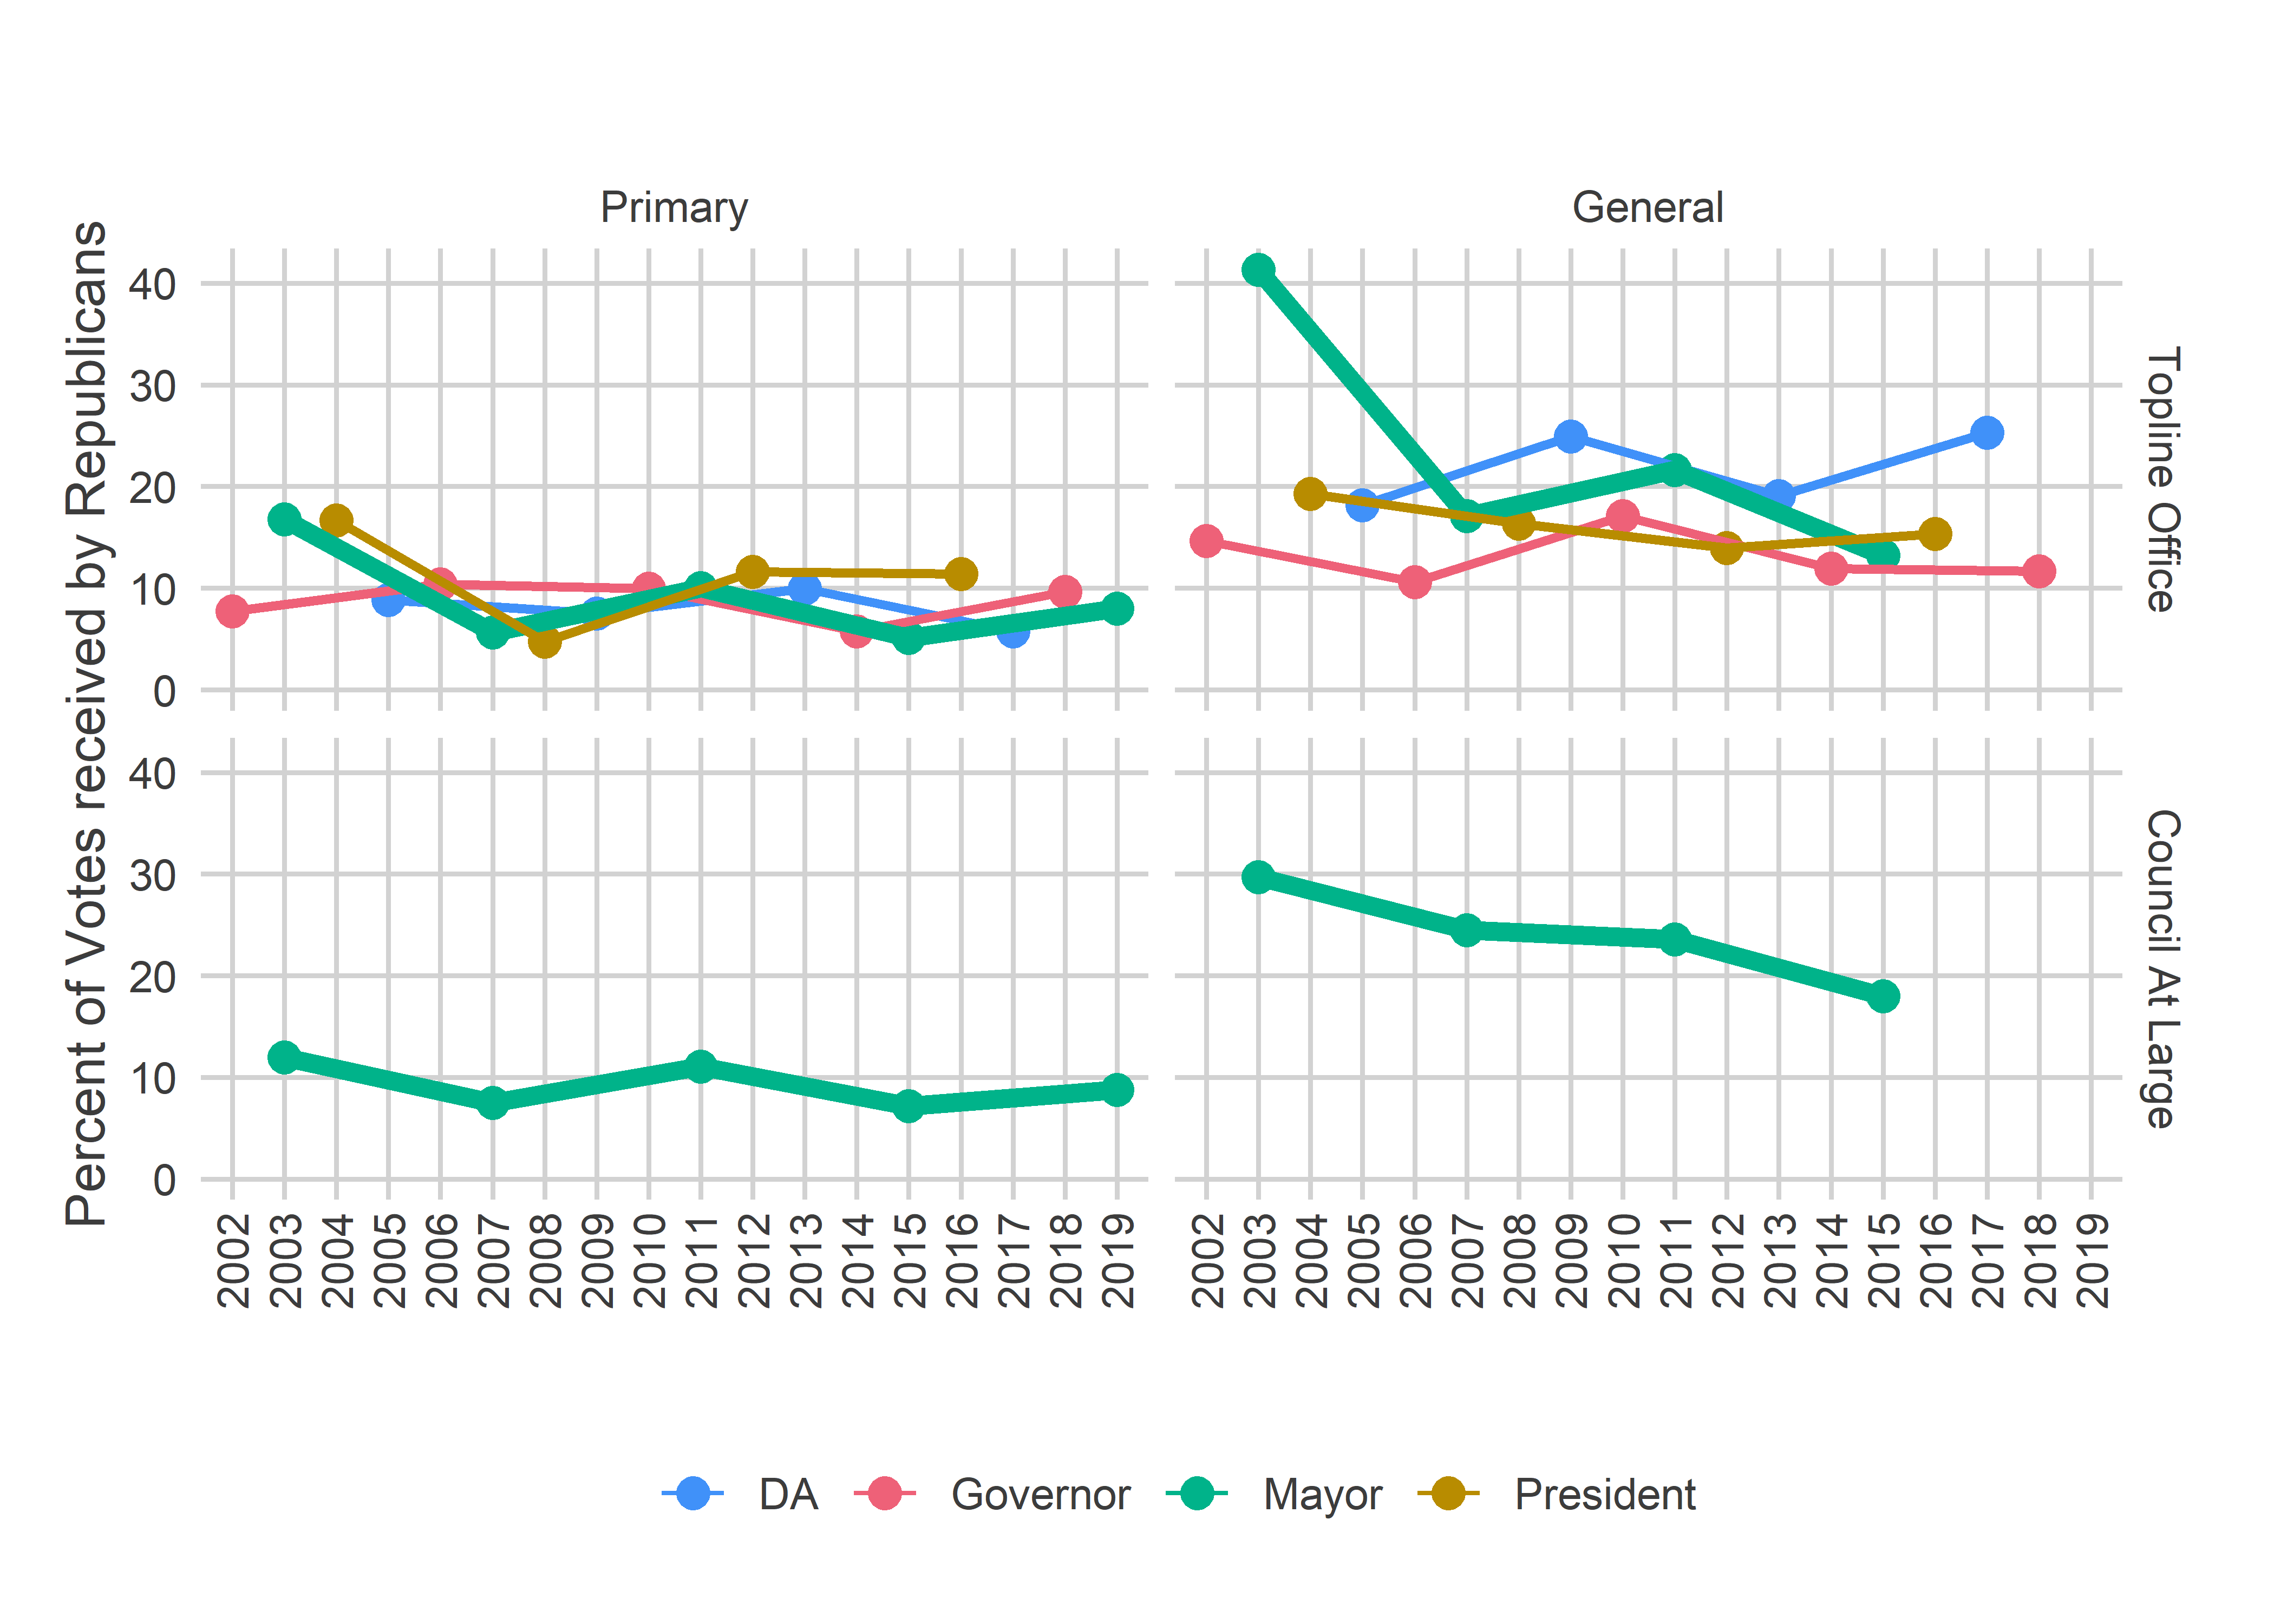
There are two clear trends in the plot above: First, Republicans receive a higher percent of the vote in Mayoral and DA General Elections, presumably because Democratic voters are more variable, and thus turn out in the Presidential and Gubernatorial General Elections, which are always competitive. They turn out less in DA and Mayoral races, where November is rarely competitive.
(Again, ignore 2003, which is an anomaly in every way.)
Second, there has been a steady decline in the percent of the vote received by Republican At Large candidates in the General; there hasn’t been a similar decline in the Primary. This could be two things: 2003 and 2007 Republican votes were helped by Frank Rizzo, who won over 7% of the vote and propped up the Republican average. But also there has been a steady decline in the votes received by the second place Republican in the table above: 6.1%, to 5.9%, to 5.0%, to 3.8%.
What does this mean for the win number? Combining the fact that Republicans win more votes in non-competitive mayoral races with the steady decline, the second place Republican will probably win more than the 3.8% of 2015, but well less than the 5.0% of 2011. With more elections, we could do a statistical estimate, but with only these few, I’ll just make a best guess. My hunch is it’ll be the lower end of the range, let’s say 4.2%. With my turnout guess of 800K, that would be 34K votes.
Where the Third Party votes come from
So the third party candidates need 34K votes. Where would their votes come from?
(Remember, you can find all of these maps and more at the new Sixty-Six Wards Portal!)
Here are Andrew Stober and Kristin Combs’s maps from 2015.
View code
library(sf)
divs <- st_read("../../data/gis/2019/Political_Divisions.shp") %>%
  rename(warddiv = DIVISION_N)df_council <- df_council %>%
  group_by(year, election, WARD19, DIV19) %>%
  mutate(pvote = votes/sum(votes))

ggplot(
  divs %>% left_join(
    df_council %>%
      filter(
        year == 2015,
        election=="general",
        CANDIDATE %in% c("ANDREW C STOBER", "KRISTIN COMBS")
      ) %>%
      mutate(warddiv = paste0(WARD19, DIV19), Candidate = format_name(CANDIDATE))
  )
) +
  geom_sf(aes(fill = 100 *pvote), color=NA) +
  facet_wrap(~Candidate) +
  scale_fill_viridis_c("Percent\nof Votes") +
  theme_map_sixtysix() %+replace%
  theme(legend.position = "right") +
  ggtitle("Third Party votes come from the Wealthy Progressive Divisions")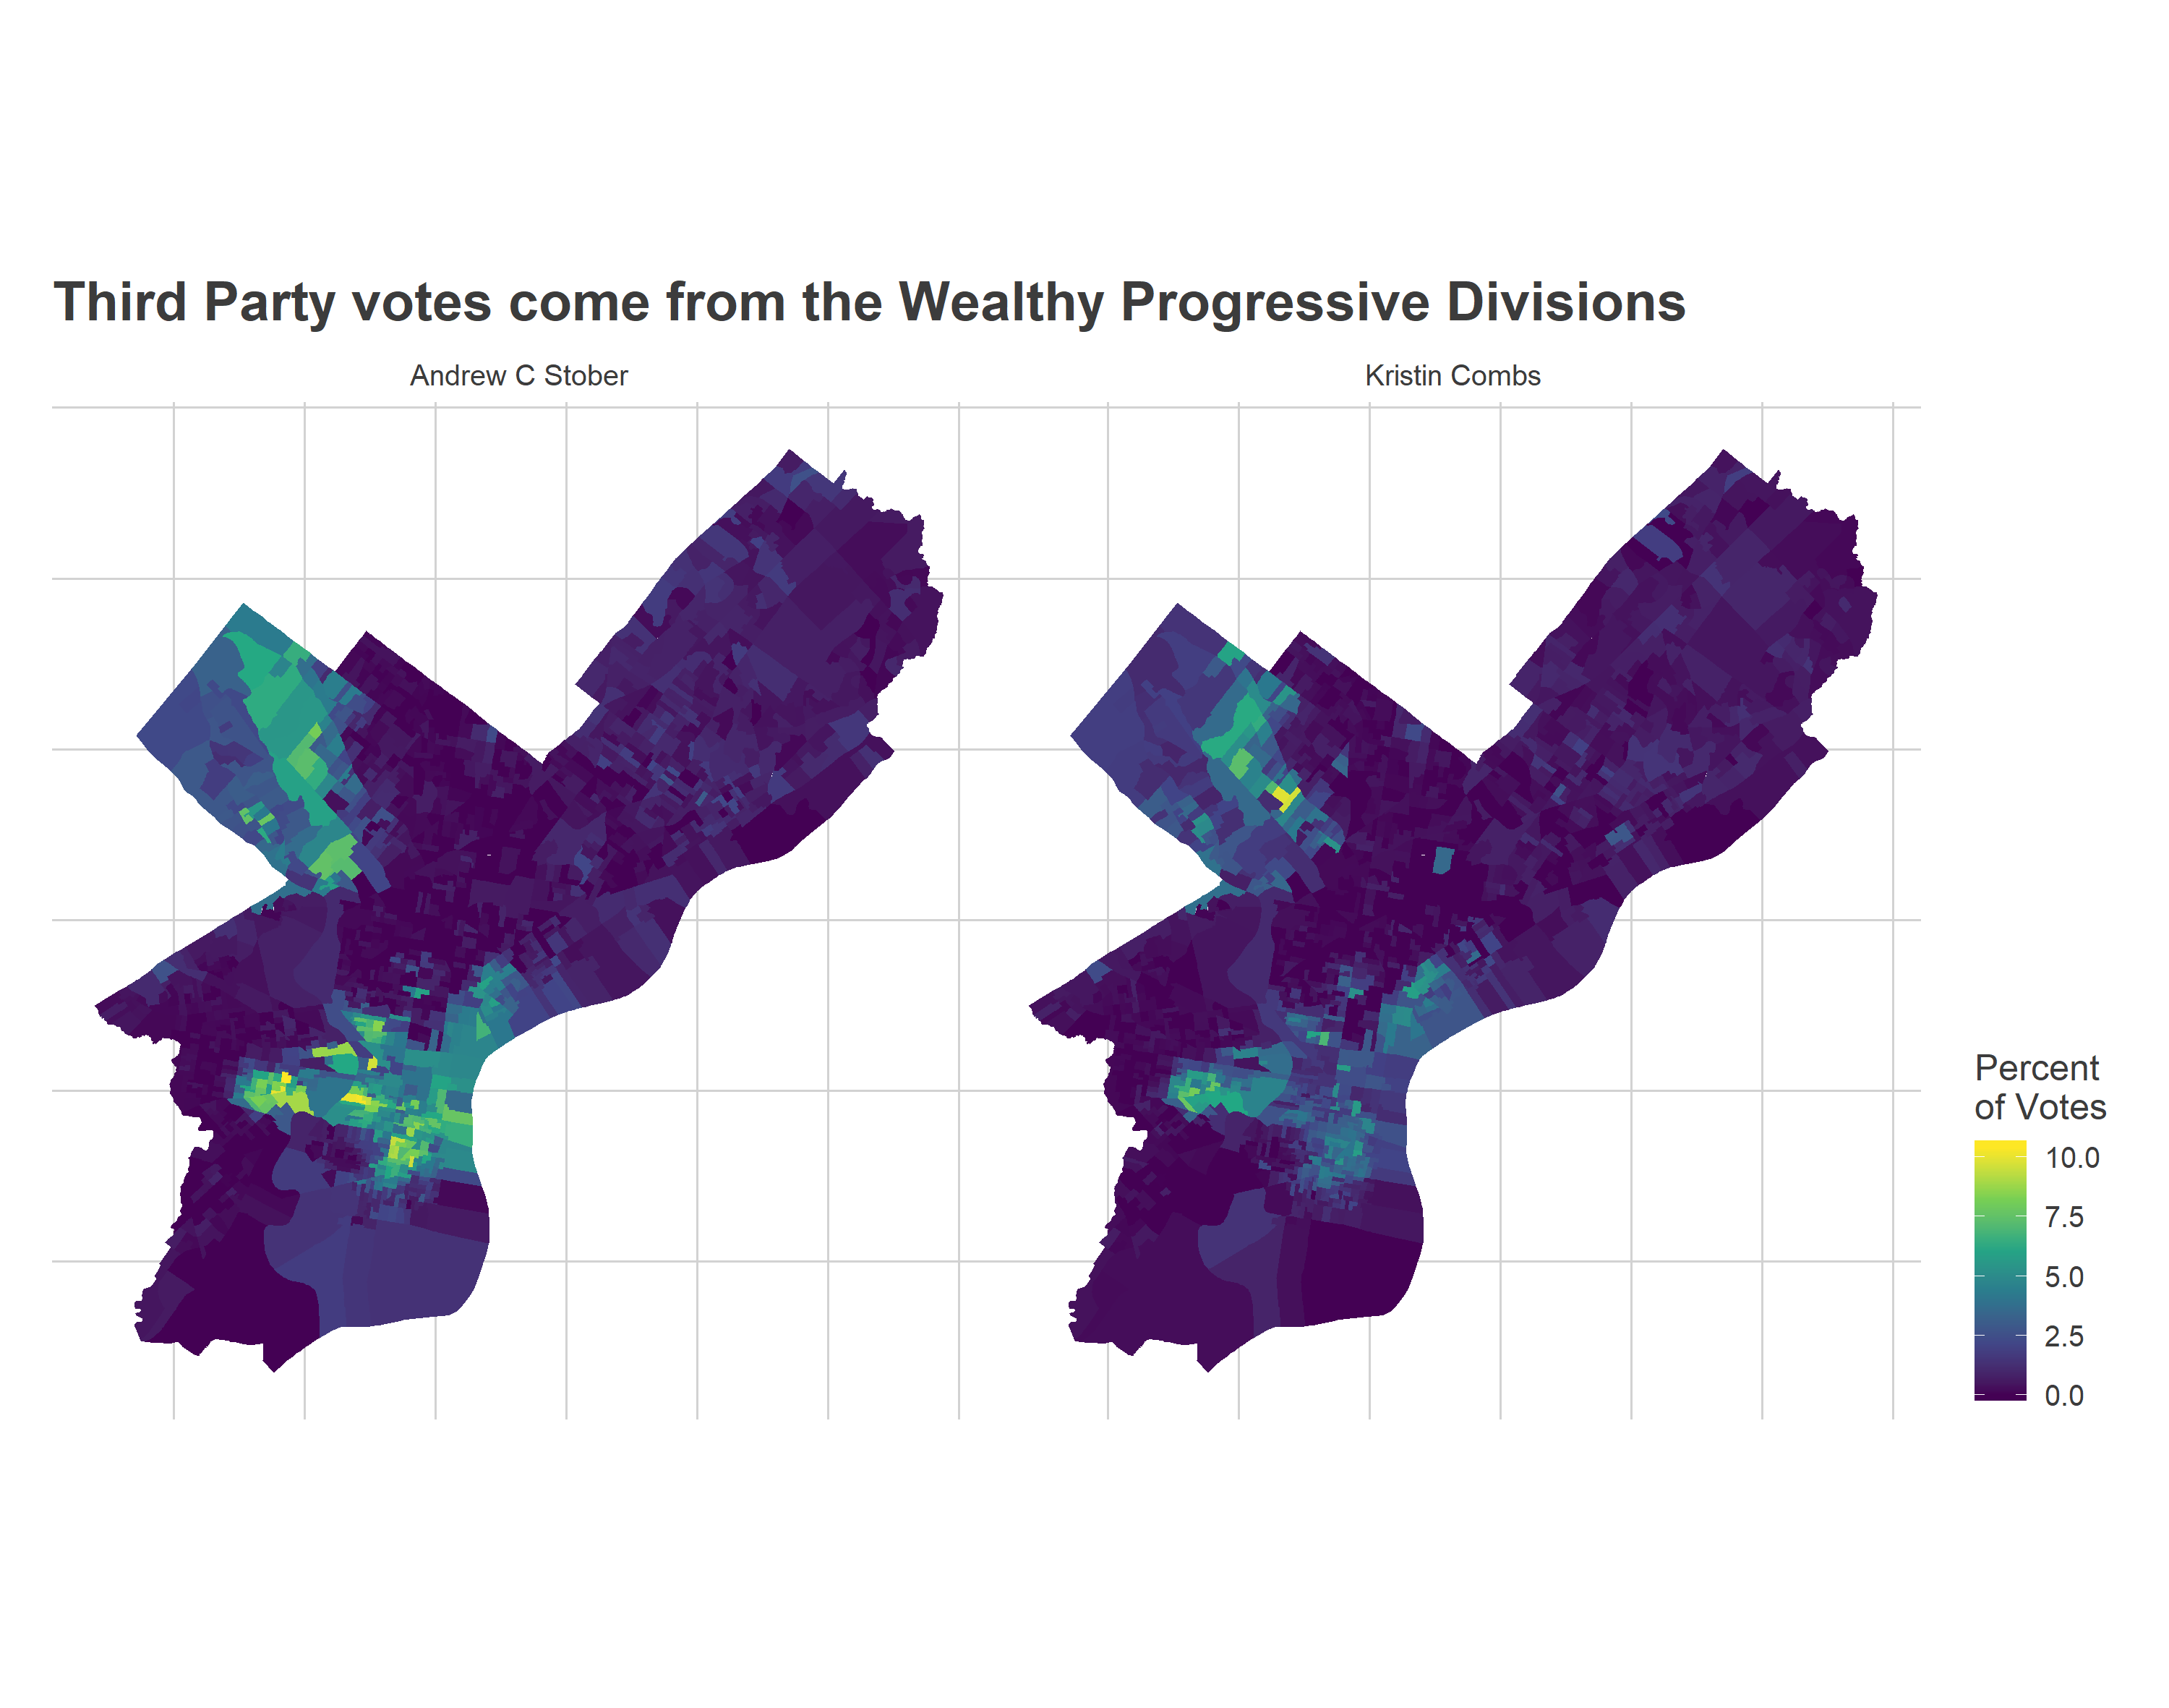
Faithful readers will recognize that basically all of their votes come from the Wealthy Progressive divisions, with an especially heave dependance on University City.
Their maps also look a lot like Krasner’s 2017 map, but with the big exception that they lacking Krasner’s support from some of Philadelphia’s Black Wards, such as the important Northwest Coalition.
View code
ggplot(
 divs %>% left_join(
    df_major %>%
      filter(
        year == 2017,
        election=="primary",
        CANDIDATE == c("LAWRENCE S KRASNER")
      ) %>%
      rename(warddiv = warddiv19) %>%
      mutate(Candidate = format_name(CANDIDATE))
  )
) +
  geom_sf(aes(fill = pvote), color=NA) +
  scale_fill_viridis_c("Percent\nof Votes") +
  theme_map_sixtysix() +
  ggtitle("Krasner's results in the 2017 Primary")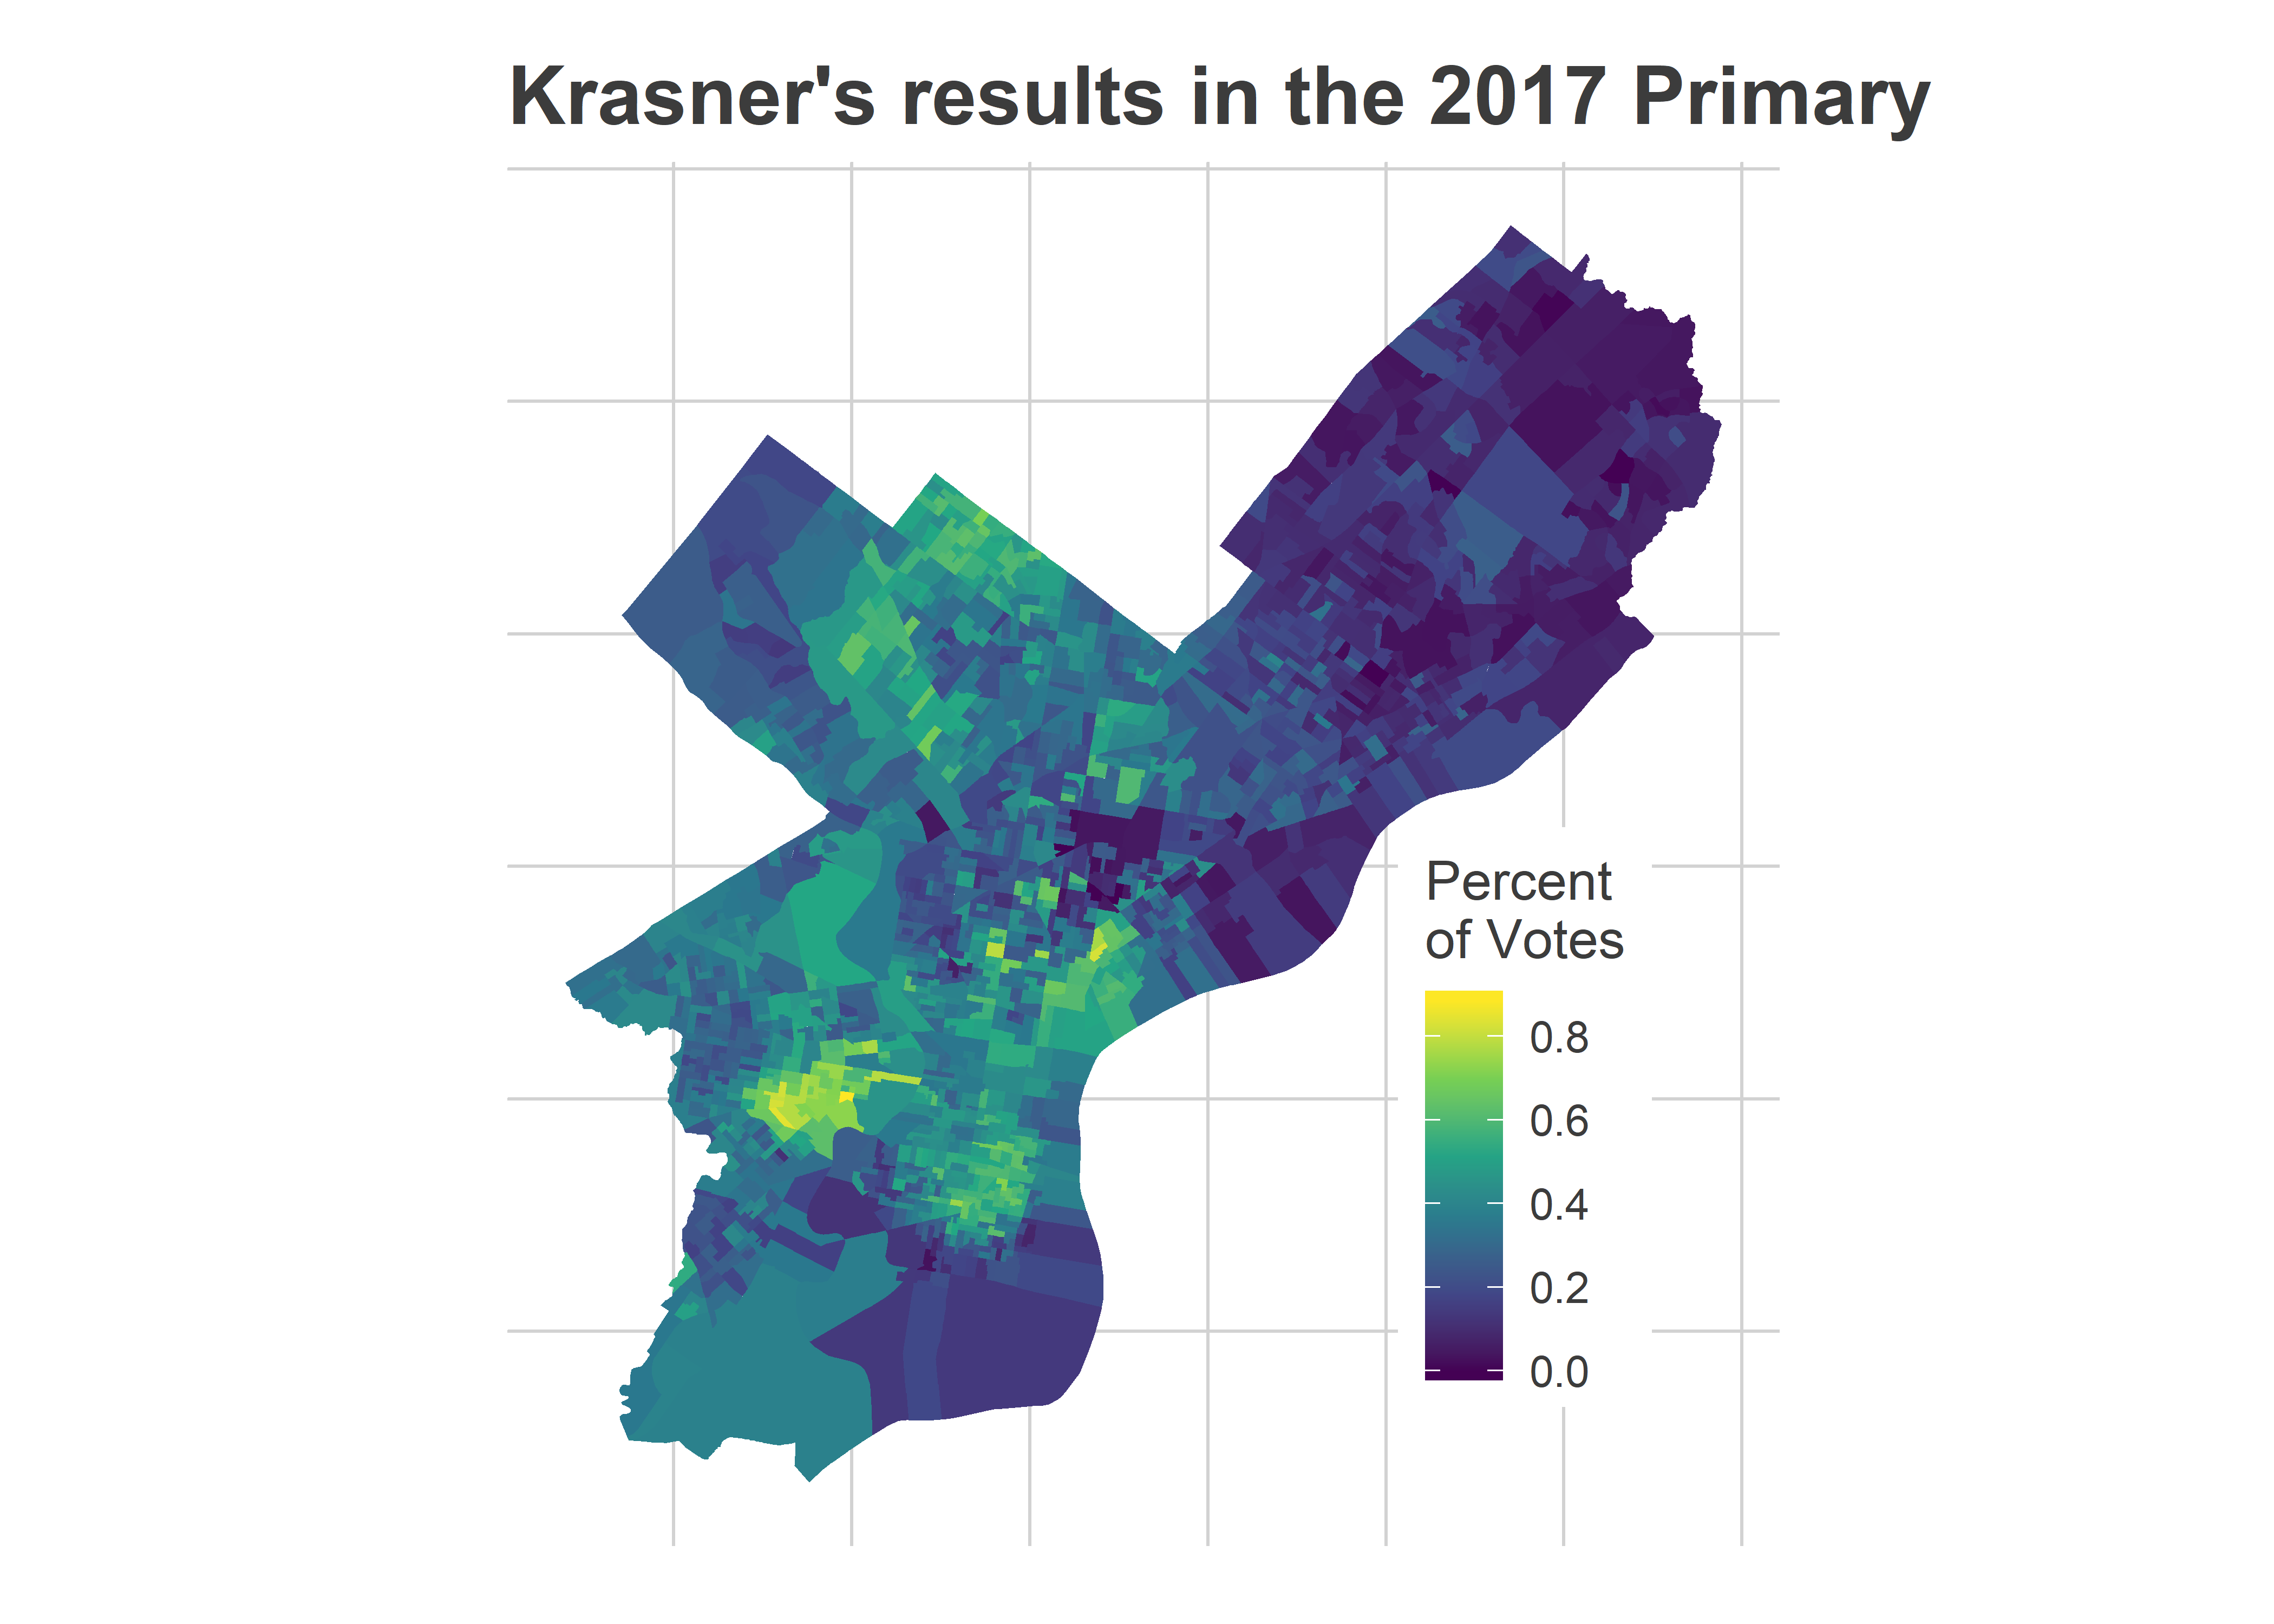
Let’s aggregate the votes to those categories, which shows the heavy differences by voting bloc.
View code
divs_svd <- safe_load("../quick_election_night_maps/divs_svd.Rda")
levels(divs_svd$cat) <- c(
  "Black Voters", "Wealthy Progressives", "White Moderates", "Hispanic North Philly"
)
cat_colors <- c(light_blue, light_red, light_orange, light_green)
names(cat_colors) <- levels(divs_svd$cat)

divs_svd$warddiv <- divs_svd$DIVISION_N

cat_plot <- bind_rows(
  df_council %>%
    filter(
      year == 2015,
      election=="general",
      CANDIDATE %in% c("ANDREW C STOBER", "KRISTIN COMBS")
    ) %>%
    mutate(warddiv = paste0(WARD19, DIV19)),
  df_major %>%
    filter(year == 2017, election=="primary", CANDIDATE=="LAWRENCE S KRASNER")%>%
    rename(warddiv=warddiv19),
    df_major %>%
    filter(year == 2016, election=="primary", CANDIDATE=="BERNIE SANDERS")%>%
    rename(warddiv=warddiv19)
) %>%
  mutate(
    Candidate = format_name(CANDIDATE),
    div_votes = ifelse(votes==0, 0, votes / pvote)
  ) %>%
  left_join(divs_svd) %>%
  group_by(Candidate, year) %>%
  mutate(citywide_pvote = weighted.mean(pvote, w=div_votes)) %>%
  group_by(Candidate, year, cat) %>%
  summarise(
    citywide_pvote=citywide_pvote[1],
    cat_votes = sum(votes),
    cat_pvote=weighted.mean(pvote, w=div_votes)
  ) %>%
  ungroup() %>%
  mutate(
    scaled_pvote = cat_pvote / ifelse(Candidate %in% c("Lawrence S Krasner", "Bernie Sanders"), 10, 1),
    Candidate_with_year = sprintf("%s (%s)", Candidate, year)
  )

ggplot(
  cat_plot,
  aes(x=cat, y=100*scaled_pvote)
) +
  geom_bar(stat="identity", aes(fill=cat)) +
  scale_fill_manual("", values=cat_colors) +
  facet_wrap(~Candidate_with_year) +
  theme_sixtysix()%+replace%
  theme(axis.text.x = element_blank()) +
  ylab("Percent of Vote") +
  xlab(NULL) +
  ggtitle("Percent of Vote by Coalition", "Krasner/Sanders's percents scaled down by 10x")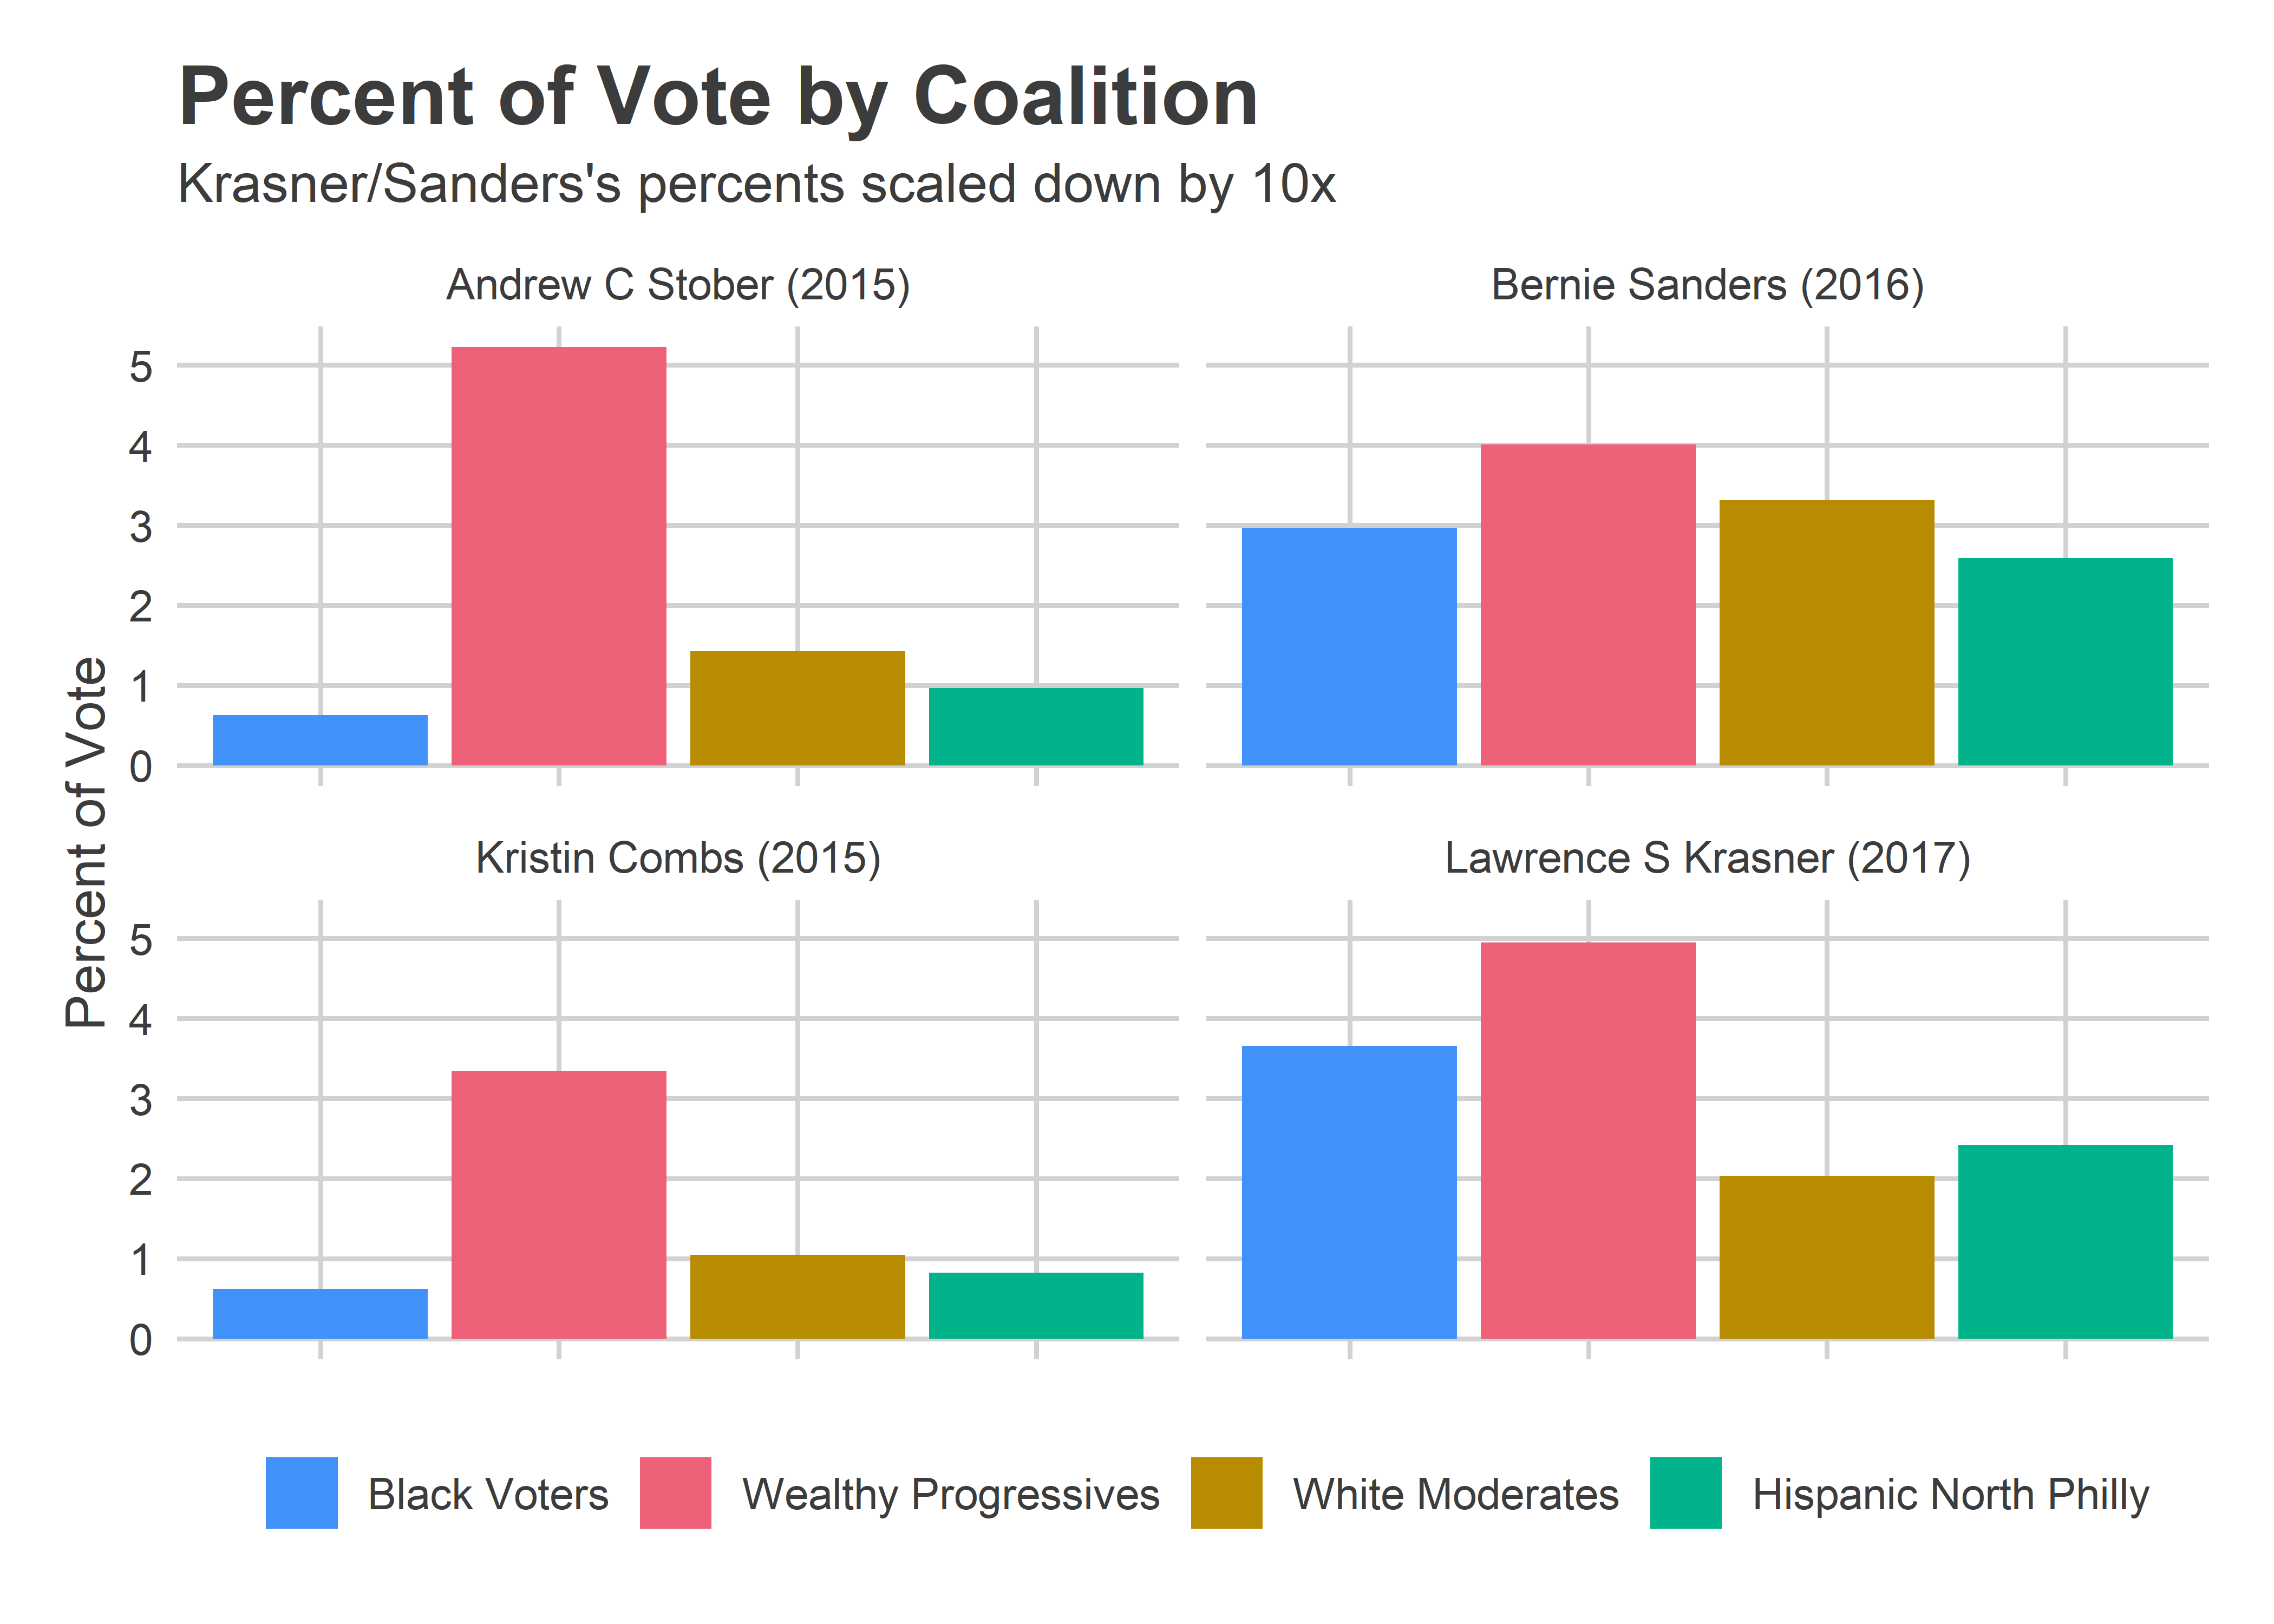
Stober won 5% of the vote from the Wealthy Progressives, but less than 1.5% from each of the other blocs. And his lowest came from the largest bloc, the Black Voters. This is a trend that is likely to continue this year, those Wards are the most consistent voters for the Democratic Party. And with a number of compelling Black candidates on the ballot as Democrats, I’d think it unlikely that too many would additionally cast votes for the third party.
The third party would need those Black Wards to have a shot. The Wealthy Progressive wards that form the third party base have represented only 28 and 24% of the vote in the 2017 and 2018 General Elections, respectively.
View code
turnout_by_cat <- df_major %>%
  filter(is_primary_office) %>%
  group_by(year, election, warddiv19) %>%
  summarise(votes = sum(votes)) %>%
  left_join(divs_svd, by=c("warddiv19" = "DIVISION_N")) %>%
  group_by(year, election, cat) %>%
  summarise(votes=sum(votes)) %>%
  group_by(year, election) %>%
  mutate(prop=votes/sum(votes)) %>%
  ungroup() %>%
  mutate(
    cycle = get_cycle(year)
  )

ggplot(
  turnout_by_cat %>% filter(election == "general"),
  aes(x=year, y=prop*100, color = cat)
) +
  geom_line(aes(group=cat), size=2) +
  annotate(
    geom="text",
    x = "2007",
    y = c(48, 17, 28, 8),
    label = names(cat_colors),
    color=cat_colors,
    fontface="bold"
  ) +
  scale_color_manual("", values=cat_colors, guide=FALSE) +
  scale_y_continuous("Percentage of total turnout") +
  scale_x_discrete("") +
  # facet_wrap(~year) +
  theme_sixtysix() %+replace%
  theme(axis.text.x = element_text(angle = 90)) +
  expand_limits(y=0)+
  ggtitle("Turnout in General Elections by Neighborhood Bloc")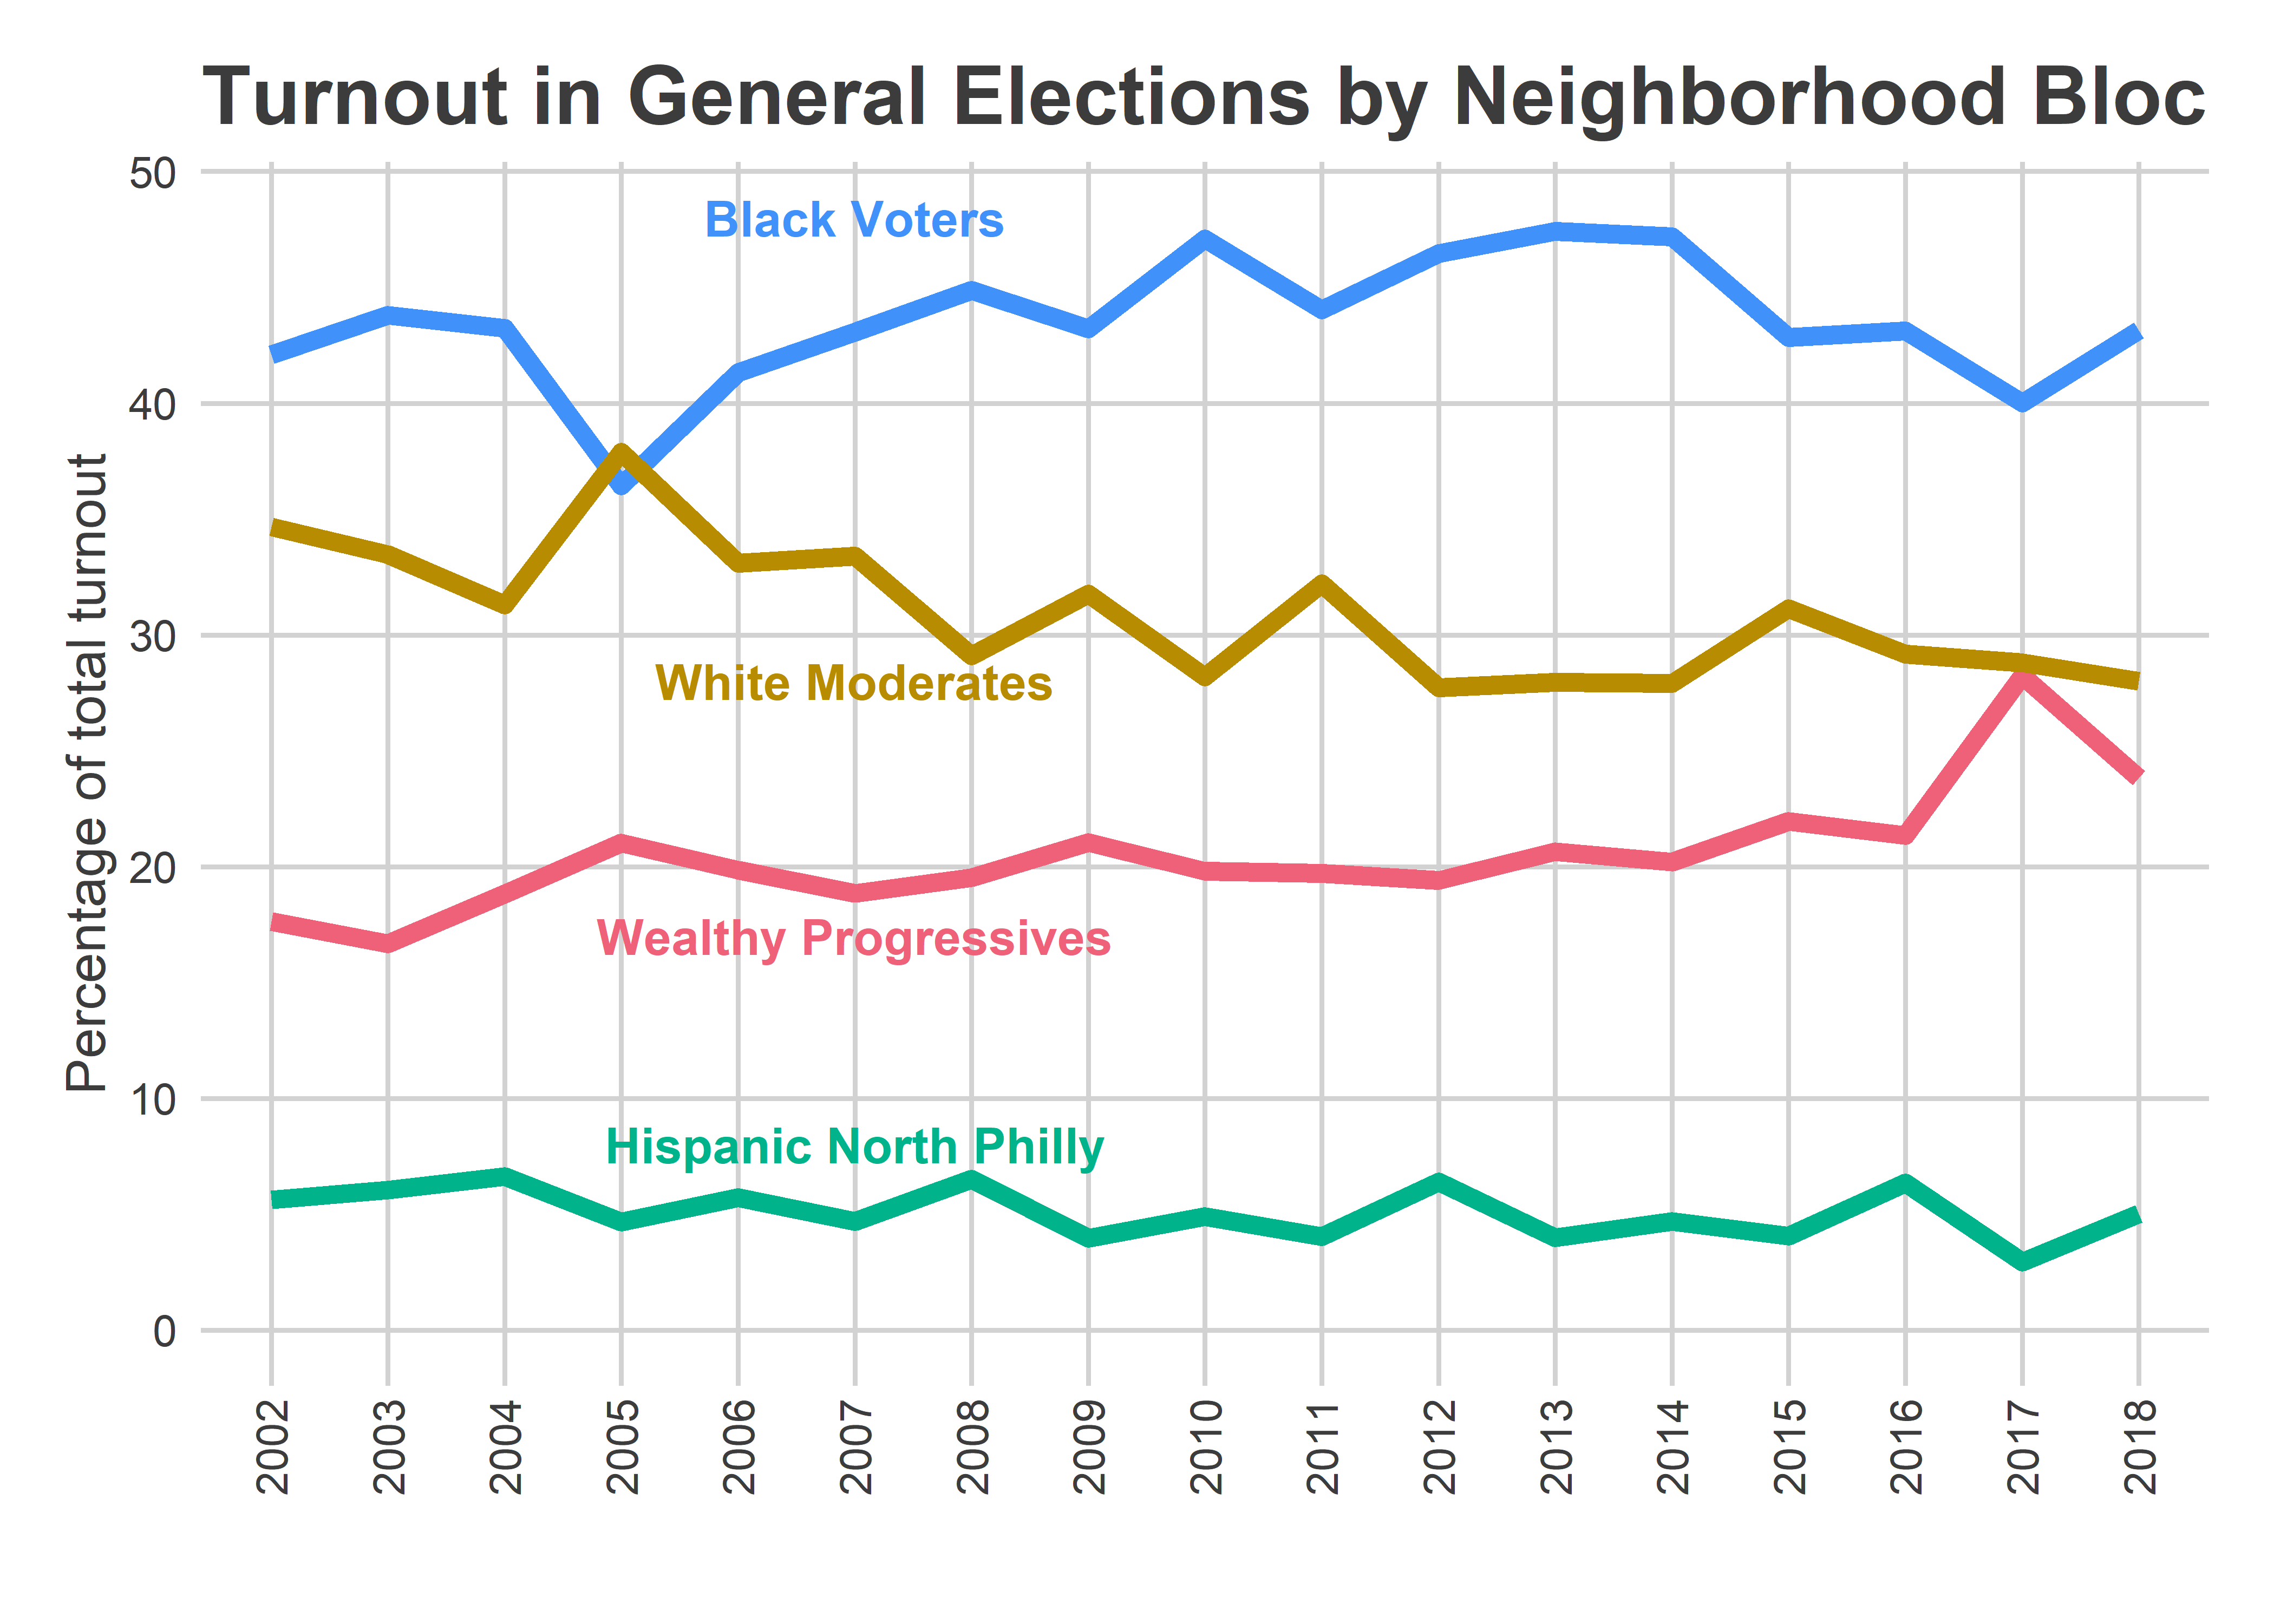
What would it take to win?
Let’s connect all the pieces above.
Let’s assume…
- Total Turnout: 800K
- Vote received by 2nd place Republican: 4.2%
- Third Party receives 0.6% of the vote in Black Voter Divisions, who have 42% of the turnout.
- Third Party receives 1.2% of the vote in White Moderate Divisions, who have 28% of the turnout.
- Third Party receives 0.9% of the vote in Hispanic N Philly Divisions, who have 4% of the turnout.
The Black Voter Bloc assumptions may strike you as low, and are crucial to the answer. The Working Families Party’s candidates Kendra Brooks and Nicolas O’Rourke, a Black organizer and Black pastor, respectively, may certainly do better than the White third party candidates of five years ago. On the other hand, these are the Divisions where the Democratic Ward recommendations have the largest effects, and where third parties typically do worst. Plus, they carried Isaiah Thomas and Katherine Gilmore Richardson to victory in May, and may be unlikely to forgo votes for them in November. To be cautious, I’ll consider a second scenario, where the third party candidates double their votes in Black Voter, White Moderate, and Hispanic North Philly Divisions.
Under the assumptions above, the third party candidates win 0.84% of the vote in the non Wealthy Progressive Divisions. To hit 4.0% citywide would require 13% of the vote among the Wealthy Progressive Divisions, or 27,000 of the Divisions’ 208,000 votes cast for At Large. For reference, Krasner received 24,000 votes (50%) from the Wealthy Progressive Divisions in the 2017 Primary.
View code
pvotes = c(0.6, 1.2, 0.9) * 2
turnouts = c(42, 28, 4)

pnonwealthy <- sum(turnouts)/100
pwealthy <- 1 - pnonwealthy

mean_among_nonwealthy <- weighted.mean(pvotes, w=turnouts)
# mean_among_nonwealthy

needed_mean_among_wealthy <- (4.0 - (pnonwealthy * mean_among_nonwealthy)) / pwealthy
# needed_mean_among_wealthy
Hitting that 13% is a huge, likely impossible task. It would require basically every Krasner voter to spend votes on the third party. In 2015, Andrew Stober’s single best Division was 27-01, in which he received 10.4% of the vote (I assume he was standing outside). So to win, this year’s Third Party candidates would have to do better on average across all 280 Wealthy Progressive Divisions than the best 2015 Third Party candidate did in his best Division.
Instead, suppose the third party candidates did twice as well in the Black, White Moderate, and Hispanic divisions. Then they would need 10.6% of the vote from Wealthy Progressives. That is slightly more doable, but still requires them outperforming Stober’s best division, on average.
Could it happen? The only way is with an unprecedented coordination of Democratic voters, sacrificing votes for their party in favor of a strategic vote for their favorite runners up. Nobody came close in 2015 or before, but in a post-2016 world, who knows.