Sorry for the radio silence. With the 2021 Democratic Primary on May 18th, and mail-in ballots being sent out this week, it’s now or never to think out loud about this election.
I have a lot of weakly-related threads of thoughts going into this election, so I’m going to structure this post as a series of sections, each of which should probably be their own posts. Here’s what I’m looking at with a month to go in the races.
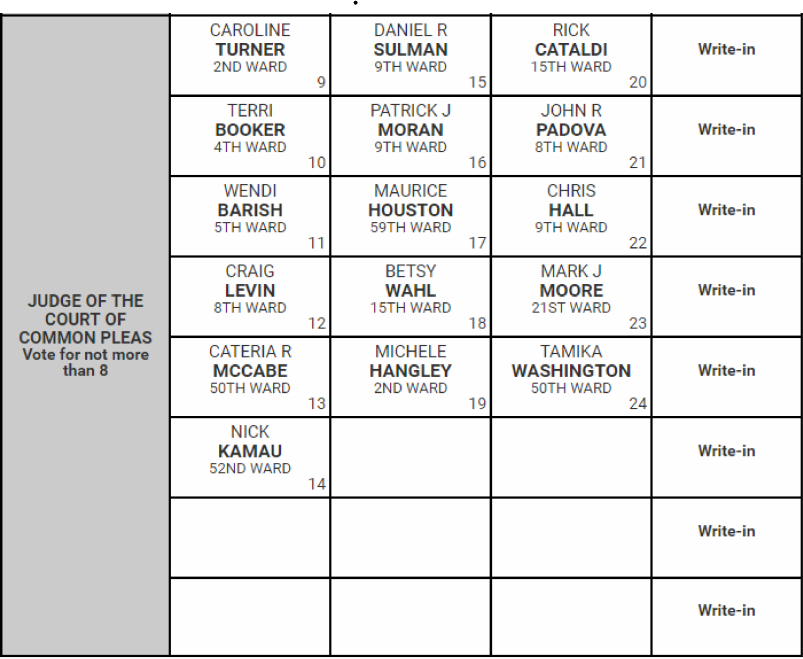
Ballot Position Winners and Losers
The Common Pleas candidates had their ballot draw, and Caroline Turner won the top spot. That first position has won in every election since at least 2009. Just being in the first column nearly triples a candidate’s votes.
 .
.
This year, we have a small race: sixteen candidates are contesting eight seats. Sadly, the winners are easy to predict just from structural factors; voters pay little attention to the race, so it’s hard for candidates to break through, and structural factors like ballot position dominate. In 2019, I predicted the races pretty well using just ballot position, gender, Democratic City Committee endorsements, and Philadelphia Bar Association recommendations.
Speaking of those recommendations, we have an interesting test of them this year. Two years ago was the first time the Bar’s “Highly Recommended” rating seemed to have real teeth, with three of the four candidates winning, including Tiffany Palmer with a terrible position and no DCC backing. That was the one way the simulations really failed. This year, those ratings include five Highly Recommended candidates, seven Recommended, and four Not Recommended. Four of those Highly Recommended candidates are in the second or third column, and will be trying to replicate Kyriakakis’ and Palmer’s 2019 Highly Recommended wins from poor positions.
Some other interesting things to watch:
- This is the first year that the DCC has endorsed a slate of entirely Bar-Recommended judges, including three Highly Recommended. So that severly dampens the chances of a Not Recommended judge.
- Five of the six first-column candidates are Recommended by the Bar, and four of those are additionally endorsed by the DCC. The only Recommended-but-not-DCC-endorsed candidate is Caroline Turner, who’s in the top ballot position, and the lone first-column candidate who was Not Recommended is second-position Terri Booker.
When I rerun my simulation model from 2019, here are the results.
View code
library(tidyr)
library(dplyr)
library(ggplot2)
library(magrittr)
library(sf)

devtools::load_all("../../admin_scripts/sixtysix")

ballot <- read.csv("../../data/common_pleas/judicial_ballot_position.csv")
ballot$name <- tolower(ballot$name)
ballot$name <- gsub("[[:punct:]]", " ", ballot$name)
ballot$name <- trimws(ballot$name)
ballot$year <- as.character(ballot$year)

df_major <- readRDS("../../data/processed_data/df_major_20210118.Rds")
df <- df_major %>%
  filter(
    office == "JUDGE OF THE COURT OF COMMON PLEAS",
    year >= 2009,
    election_type=="primary",
    party=="DEMOCRATIC"
  ) %>%
  mutate(candidate = tolower(candidate)) %>%
  group_by(warddiv, year, candidate) %>%
  summarise(votes = sum(votes))

df_total <- df %>%
  group_by(year, candidate) %>%
  summarise(votes = sum(votes))

election <- data.frame(
  year = c(2009, 2011, 2013, 2015, 2017, 2019),
  votefor = c(7, 10, 6, 12, 9, 6)
) %>% mutate(year=as.character(year))

election <- election %>% left_join(
  ballot %>% group_by(year) %>% summarise(
    nrows = max(rownumber),
    ncols = max(colnumber),
    ncand = n(),
    n_philacomm = sum(philacommrec >= 1),
    n_inq = sum(inq),
    n_dcc = sum(dcc)
  )
)

df_total <- df_total %>%
  inner_join(
    ballot,
    by = c("candidate" = "name", "year" = "year")
  )

df_total <- df_total %>%
  filter(candidate != "write in")

df_total <- df_total %>%
  left_join(election, by="year") %>%
  group_by(year) %>%
  mutate(
    pvote = votes / sum(votes),
    rank=rank(desc(votes)),
    winner = rank <= votefor
  )

library(forcats)

prep_df_for_lm <- function(df, use_candidate=TRUE){
  df <- df %>% mutate(
    rownumber = fct_relevel(factor(as.character(rownumber)), "3"),
    colnumber = fct_relevel(factor(as.character(colnumber)), "3"),
    col1 = colnumber == 1,
    col2 = colnumber == 2,
    col3 = colnumber == 3,
    row1 = rownumber == 1,
    row2 = rownumber == 2,
    is_rec = philacommrec > 0,
    is_highly_rec = philacommrec==2,
    inq=inq>0
  )
  if(use_candidate)
    df <- df %>% mutate(
      candidate_year = paste(candidate, year, sep="::")
    )
  return(df)
}

df_complemented <- df %>%
  mutate(ward = substr(warddiv, 1, 2)) %>%
  group_by(ward, year, candidate) %>%
  summarise(votes=sum(votes)) %>%
  group_by(ward) %>%
  mutate(pvote = votes / sum(votes)) %>%
  inner_join(
    df_total %>% prep_df_for_lm(),
    by = c("year", "candidate"),
    suffix = c("", ".total")
  )

library(lme4)

## better opt: https://github.com/lme4/lme4/issues/98
library(nloptr)
defaultControl <- list(
  algorithm="NLOPT_LN_BOBYQA",xtol_rel=1e-6,maxeval=1e5
)
nloptwrap2 <- function(fn,par,lower,upper,control=list(),...) {
    for (n in names(defaultControl))
      if (is.null(control[[n]])) control[[n]] <- defaultControl[[n]]
    res <- nloptr(x0=par,eval_f=fn,lb=lower,ub=upper,opts=control,...)
    with(res,list(par=solution,
                  fval=objective,
                  feval=iterations,
                  conv=if (status>0) 0 else status,
                  message=message))
}

if(FALSE){
  rfit <- lmer(
    log(pvote + 0.001) ~
      (1 | candidate_year)+
        row1 + row2 +
        I(gender == "F") +
        col1 + col2 + I(col1 * row1) +
        dcc + inq +
        is_rec + is_highly_rec +
        factor(year) +
        (
            I(gender == "F") +
            col1 + col2 + I(col1 * row1) +
            dcc + inq +
            is_rec + is_highly_rec
          | ward
        ),
          df_complemented
  )
  saveRDS(rfit, file="rfit.RDS")
} else {
  rfit <- readRDS("rfit.RDS")
}

ranef <- as.data.frame(ranef(rfit)$ward) %>%
  tibble::rownames_to_column("ward")  %>%
  gather("variable", "random_effect", -ward) %>%
  mutate(
    fixed_effect = fixef(rfit)[variable],
    effect = random_effect + fixed_effect
  )

wards <- st_read("../../data/gis/warddivs/201911/Political_Wards.shp", quiet=TRUE)
wards <- wards %>%
  mutate(ward = sprintf("%02d", asnum(WARD_NUM)))
ward_effects <- wards %>%
  left_join(
    ranef,
    by=c("ward")
  )

format_effect <- function(x){
  paste0("x", round(exp(x), 1))
}

fill_min <- ward_effects %>%
  filter(
    variable %in% c(
      "col1TRUE", "col2TRUE", "dcc", "inq", "is_recTRUE", "is_highly_recTRUE"
    )
  )  %>%
  with(c(min(effect), max(effect)))

format_variables <- c(
  is_recTRUE="Recommended",
  is_highly_recTRUE="Highly Recommended",
  dcc = "Dem. City Committee Endorsement",
  inqTRUE = "Inquirer",
  col1TRUE = "First Column",
  col2TRUE = "Second Column"
)

ward_effects$variable_name <- factor(
  format_variables[ward_effects$variable],
  levels = format_variables
)

replace_na <- function(x, r=0) ifelse(is.na(x), r, x)

df_2021 <- ballot %>%
  filter(year == 2021) %>%
  mutate(
    philacommrec = replace_na(philacommrec),
    dcc = replace_na(dcc),
    inq = (philacommrec > 0),
    year = "2019"  ## fake year to trick lm
  ) %>%
  prep_df_for_lm(use_candidate = FALSE) %>%
  left_join(
    expand.grid(
      name = unique(ballot$name),
      ward = unique(ward_effects$ward)
    )
  )

## pretend it's one candidate, but then marginalize over candidates
df_2021$log_pvote <- predict(
  rfit,
  newdata = df_2021 %>%
    mutate(candidate_year = df_complemented$candidate_year[1])
)

df_2021 <- df_2021 %>%
  mutate(pvote_prop = exp(log_pvote))

sd_cand <- sd(ranef(rfit)$candidate_year$`(Intercept)`)
simdf <- expand.grid(
  sim = 1:1000,
  name = unique(df_2021$name)
) %>%
  mutate(cand_re = rnorm(n(), sd = sd_cand))

## https://econsultsolutions.com/simulating-the-court-of-common-pleas-election/
votes_per_voter <- 4.5

ward_votes <- df %>%
  filter(year == 2019) %>%
  mutate(ward=substr(warddiv, 1, 2)) %>%
  group_by(ward) %>%
  summarise(turnout=sum(votes))

simdf <- df_2021 %>%
  left_join(simdf, by=c("name")) %>%
  mutate(pvote_prop_sim = pvote_prop * exp(cand_re)) %>%
  group_by(ward, sim) %>%
  mutate(pvote = pvote_prop_sim / sum(pvote_prop_sim)) %>%
  group_by() %>%
  left_join(ward_votes, by="ward") %>%
  mutate(votes = turnout * votes_per_voter * pvote) %>%
  group_by(sim, name) %>%
  summarise(votes = sum(votes))


simdf <- simdf %>%
  group_by(sim) %>%
  mutate(
    vote_rank = rank(desc(votes)),
    pvote=100*votes/sum(votes),
    winner = vote_rank <= 8
  )

remove_na <- function(x, r=0) return(ifelse(is.na(x), r, x))
View code
ggdata <-   simdf %>% group_by(sim)  %>%
    left_join(ballot %>% filter(year==2021)) %>%
    mutate(name=format_name(name)) %>%
    group_by(name, dcc, philacommrec) %>%
    summarise(
      mean = mean(pvote),
      p975 = quantile(pvote, 0.975),
      p025 = quantile(pvote, 0.025),
      .groups = "drop"
    ) %>%
    arrange(desc(mean)) %>%
    mutate(name = factor(name, levels=name))

labx <- 9.5

ggplot(
  ggdata,
  aes(x=name, y=mean)
) +
  geom_hline(
    aes(yintercept=simdf %>% filter(vote_rank==8) %>% with(mean(pvote)))
  )+
  geom_errorbar(aes(ymin=p025, ymax=p975), width=0) +
  geom_point(
    data=ggdata %>% filter(philacommrec ==2),
    size=6,
    color="black"
  ) +
  geom_point(
    data=ggdata %>% filter(philacommrec ==1),
    size=6,
    color="grey30"
  ) +
  geom_point(
    aes(color=(dcc>0), size=as.character(philacommrec)),
    size=4
  ) +
  scale_color_manual(
    values=c(`TRUE` = colors_sixtysix()$strong_blue, `FALSE`="grey50"),
    guide=FALSE
  ) +
  scale_size_manual(
    values=c(`0` = 2, `1`=3, `2`=4),
    guide=FALSE
  ) +
  expand_limits(y=0)+
  labs(
    x=NULL,
    y="Percentage of Vote",
    title="Results over 1,000 Simulations"
  ) +
  theme_sixtysix()%+replace%
  theme(axis.text.x = element_text(angle=-90, hjust=0)) +
  annotate("text", x=11.5, y=7, hjust=0, label="Average Vote for 8th Place") +
  annotate("point", x=labx, y=17, size=4, color=colors_sixtysix()$strong_blue) +
  annotate("text", x=labx+0.4, y=17, hjust=0, label="Democratic City Committee") +
  annotate("point", x=labx, y=15, size=6, color="grey30") +
  annotate("point", x=labx, y=15, size=4, color="grey50") +
  annotate("text", x=labx+0.4, y=15, hjust=0, label="Bar Recommended")+
  annotate("point", x=labx, y=13, size=6, color="black") +
  annotate("point", x=labx, y=13, size=4, color="grey50") +
  annotate("text", x=labx+0.4, y=13, hjust=0, label="Bar Highly Recommended") +
  annotate("errorbar", x=labx, ymin=10.5, ymax=11.5, width=0)+
  annotate("text", x=labx+0.4, y=11, hjust=0, label="95% of simulations")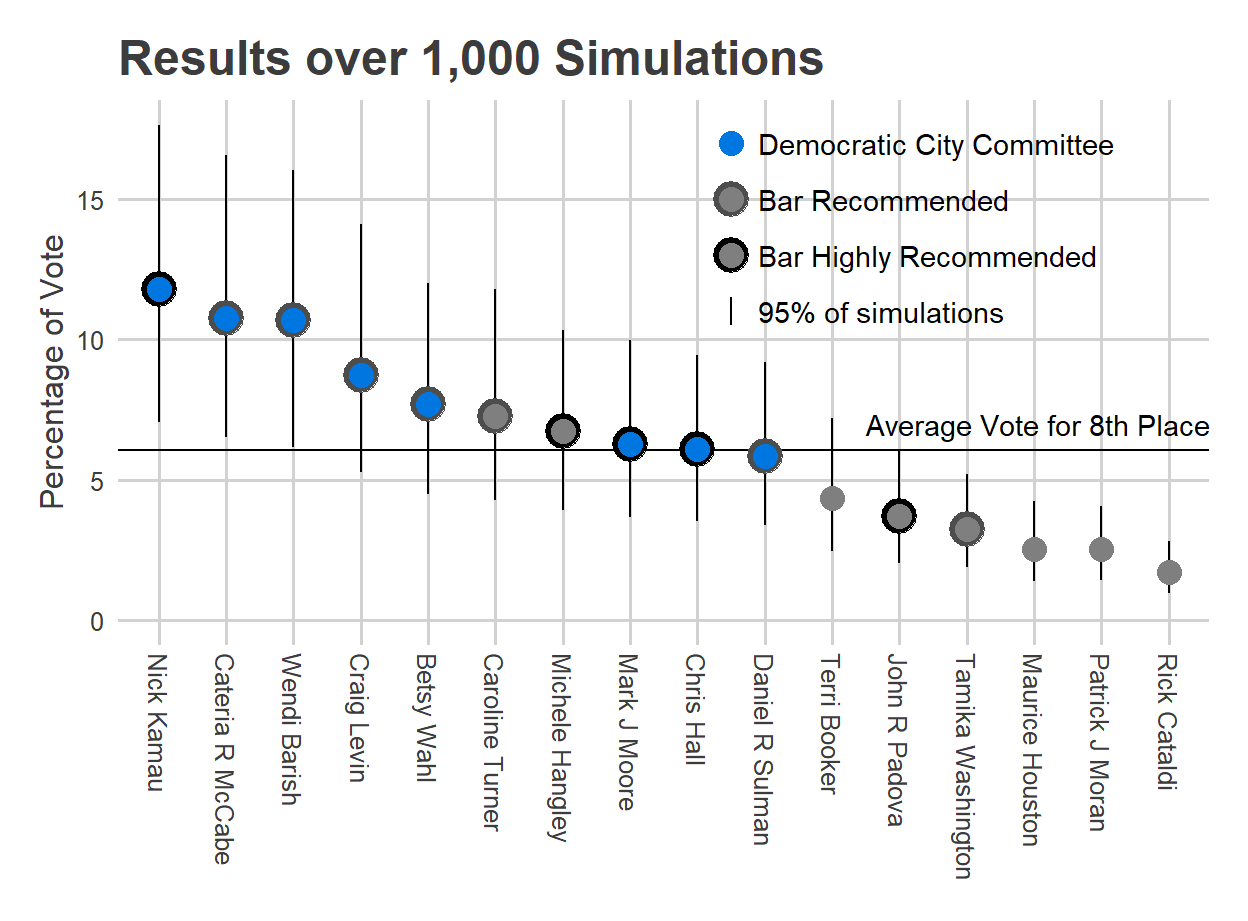
Remember, this model did pretty well in 2019, with the huge exception of underestimating the value the Bar’s High Recommendation. Four of the Highly Recommended candidates are hanging around 50% chances of winning–Hangley, Moore, Hall, and Padova–so these predictions will really depend on whether the Bar’s High Recommendation has truly grown in power.
Will mail-in results deviate from in-person?
One year ago, in the beginning of the pandemic, Democratic Primary voters who mailed in ballots were very different from those who voted in person. Krajewski in PA House 188 and Farnese in PA Senate 01 did much better on mail-ins, and Roebuck in 188 and Saval in 01 did better in person. This was true even within Divisions. I expect that difference to be smaller this time; panic and uncertainty was much higher in June 2020 than it is now. But what exactly will it be?
My guess is that Mail-In ballots will see less of a ballot position effect, and more of an endorsement effect. I imagine that people are much more likely to spend five minutes googling the candidates when the ballot is sitting on their kitchen table than when they’re holding up a line in the polling place. This would be good news for the poor-ballot-position candidates.
Mail in ballots appear about as proportional as last November (~50%). About 69,000 ballots have been requested, in an election where we might expect 150,000 voters (for context, 2017 saw 165K, but 2013, the last election with an incumbent DA, only saw 64K).
This also introduces interesting strategies for candidates. In an in-person election, the dramatic effect is getting literature in people’s hands at the polling place, via Ward endorsements or your own volunteers. But when half the voters vote at home, a campaign that can effectively target them the day they receive their ballot may get more bang for their buck.
You probably still don’t want to Bullet Vote.
Two years ago I published my polemic against casting a single vote when you’re allowed more, or “Bullet Voting”. This election gave me a clean example, and I want to try rephrasing it (to have a better link to point to).
In this election, you can vote for eight candidates. Suppose you have a single favorite, though. Should you only vote for them, to maximize their chance of winning?
No.
(To be clear, there are definitely preferences that are compatible with that strategy. They’re just more extreme than you think.)
Suppose your favorite candidate is Michele Hangley, and your second is Nick Kamau. Assume that all candidates are equally likely to win (we can complicate this later). When would it make sense to only vote for Hangley, versus when should you vote for both Hangley and Kamau?
Notice that foregoing a vote for Kamau only makes Hangley more likely to win in a single situation: where Kamau is in 8th, and Hangley in 9th. But it hurts Kamau in fourteen situations: when Kamau is in 9th, and any of the other candidates is in 8th. Thus, foregoing your vote is only optimal if the difference in your preferences for Hangley and Kamau is fourteen times greater than the average difference between Kamau and everyone else. And he’s your second favorite!
Things change when you ask “Should I vote for seven candidates or eight?” Foregoing a vote for your eight favorite candidate–call them “H”–helps each of your 1st through 7th favorite candidates when they’re in 9th place overall and H is in 8th. But it helps H in all the cases where H is in 9th place and she’s losing to one of your 9th through 16th favorite candidates. So you should forego a vote for H whenever the average value difference between your top seven candidates and H is greater than 8/7 (1.14) the average value difference between H and everyone else, and vote for H if it’s less. That’s a lot closer.
In general, suppose you’ve voted for your favorite K-1 candidates, and are wondering if you should add a vote for your Kth? Doing so will hurt your 1st through (K-1)th candidates when they lose to K, but help your Kth favorite candidate when they’re losing to the remaining N-K candidates. So you should forego a vote for K when the average value difference between candidates 1, 2, …, K-1 and candidate K, is greater than (N-K)/(K-1) times the average value difference between candidate K and candidates K+1, K+2, …, N.
How would unequal win probabilities change this? Instead of just multiplying the counts of scenarios times the average preference differences, you would need to model the exact probability of each candidate finishing in 8th and 9th, and come up with an accurate difference in expected values among the strategies.