The data
When all was said and done, I had 619 valid submissions from election day. This included data from 50 wards, and from every hour of the day. Each submission consisted of the time of day, the ward + division, and the cumulative count of votes at that division up to that time.
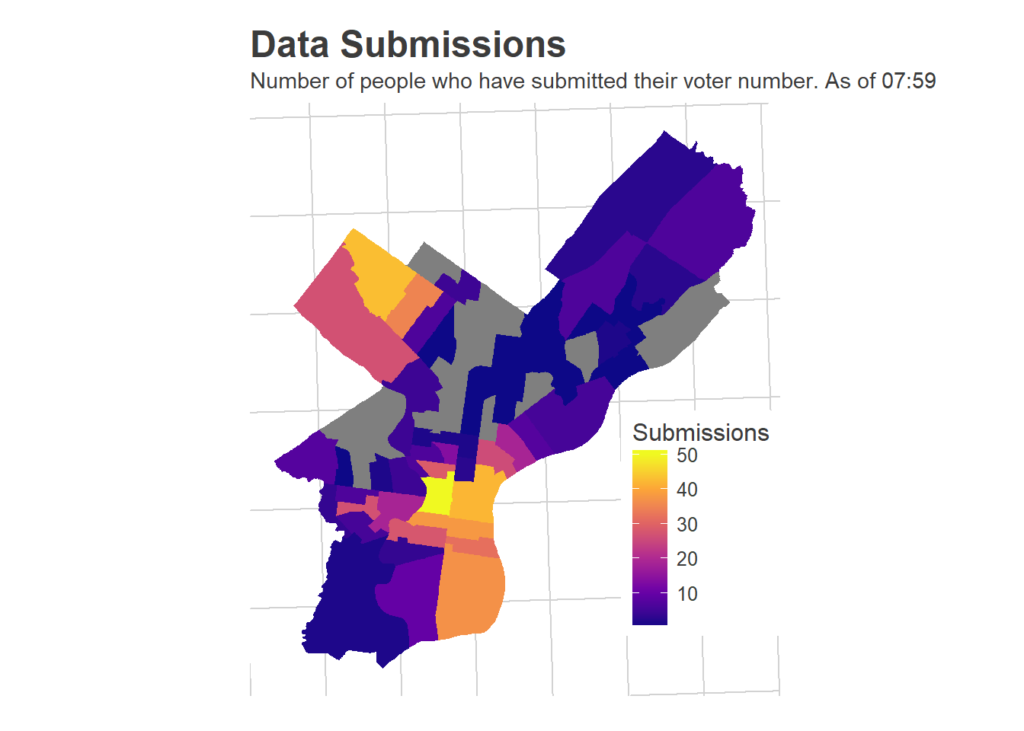
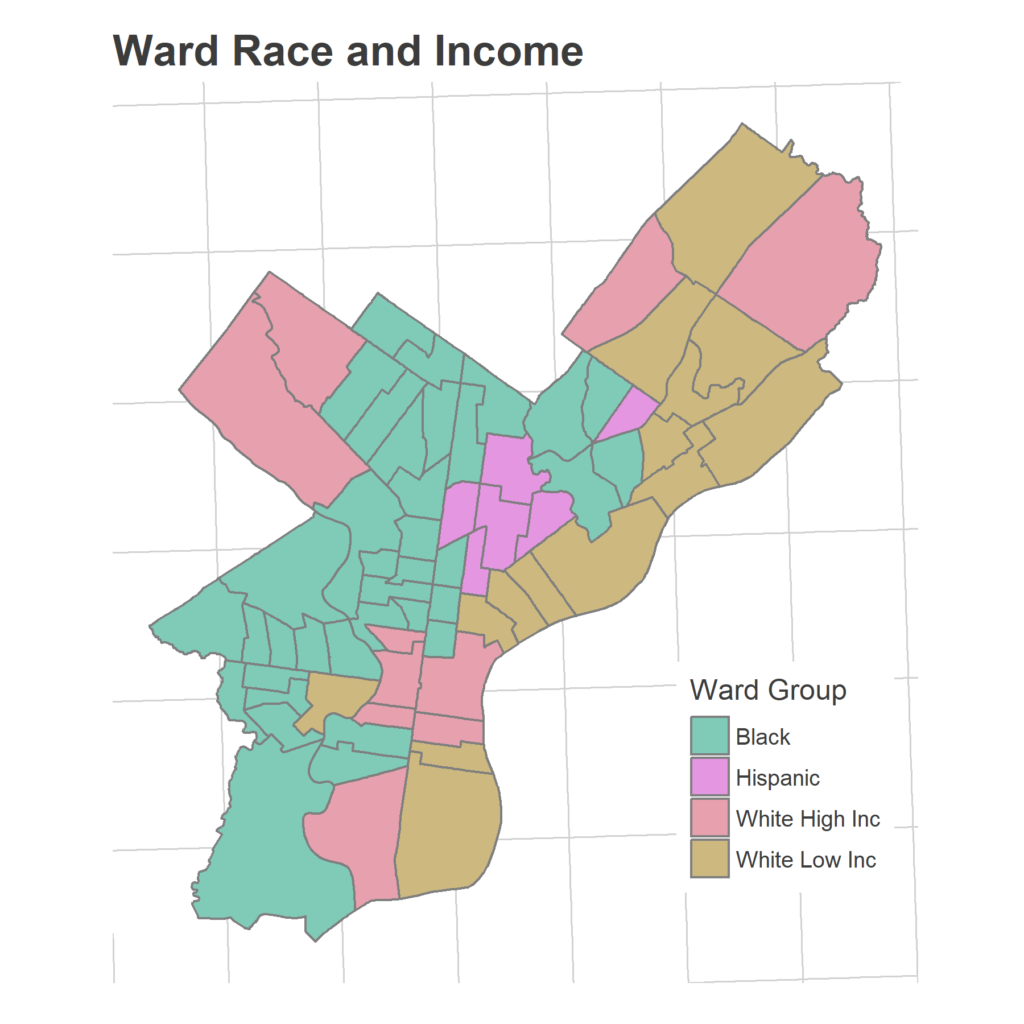
One important thing to note is that my data is not representative of the city as a whole. The map below shows where data was submitted from. I have many more points from Philadelphia’s white, predominantly wealthy wards. My model will be overweighted towards these people. I break down the results by race and income, as much as is possible, at the end.
For each point, I divide the current count by the final vote count in that division to calculate the proportional vote total at that time. This puts divisions on comparable footing. I then model the cumulative percentage of the vote across the city at each hour, treating each row of data as independent.
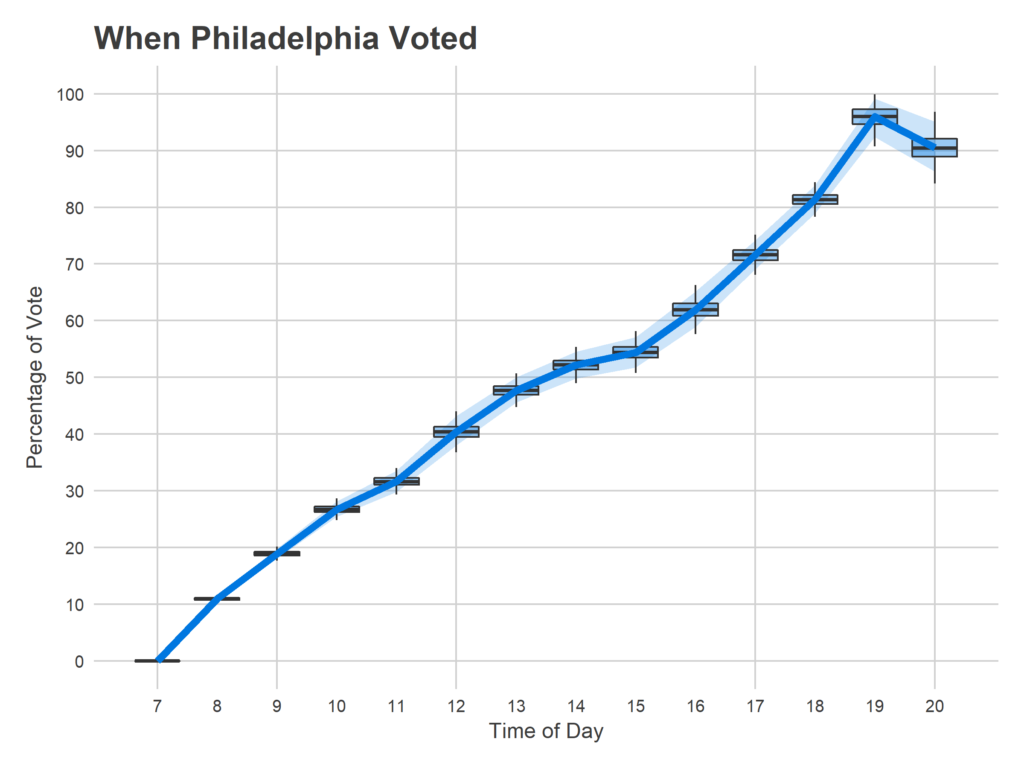
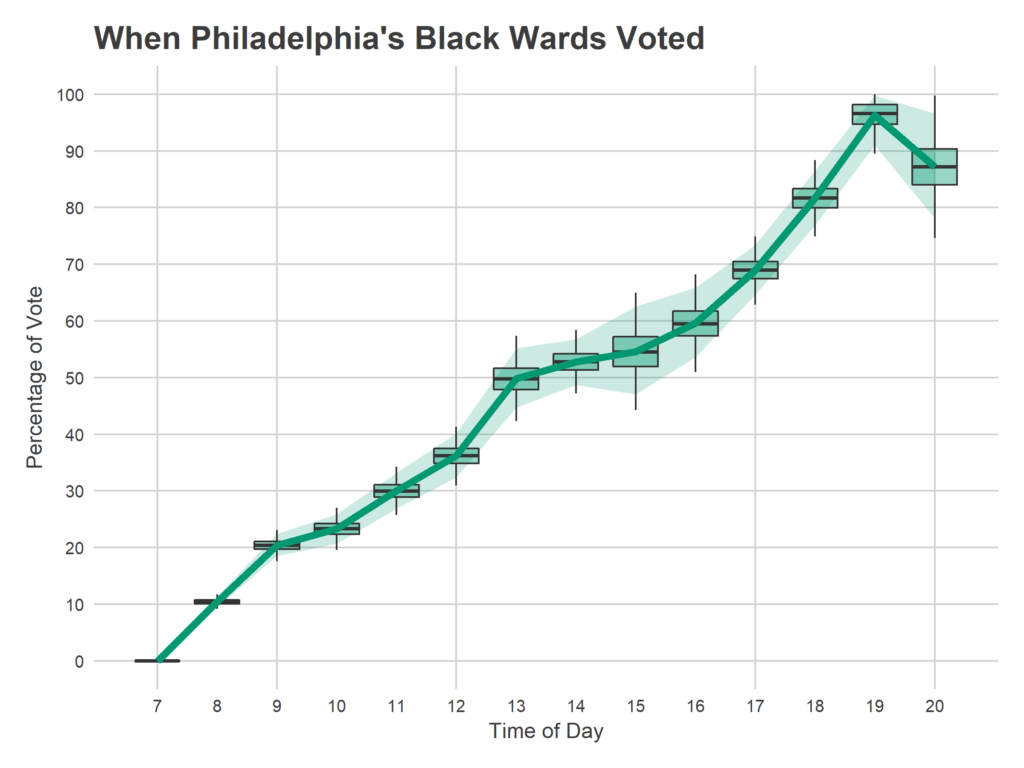
I was amazed by the steady increasing nature of the plot; I expected the distribution to be much more heavily weighted to before and after work. Voting clearly slows down between 10 and 11am, and 1 and 3pm, but the lunchtime push is much stronger than I expected. Still, after work (starting around 4pm) is by far the strongest surge.
The results between 7 and 8pm require some discussion. I don’t impose any rule that the total be increasing, and the model actually predicts that negatively many people voted in the last hour. This is due to the thunderstorm that covered the city at exactly that hour. Don’t overinterpret the negative sign, the model isn’t that smart. Basically, nobody voted. Assuming that the trend from 6-7 would have continued, we could have seen another 30,000 votes without the storm. (This is also what broke my prediction…).
One other weird thing is that my final total doesn’t finish at 100%. This means that people were reporting numbers at 8pm that didn’t match the city’s reported total. I’m not totally convinced how this happened, maybe they had actually voted earlier and got confused by the submission form?
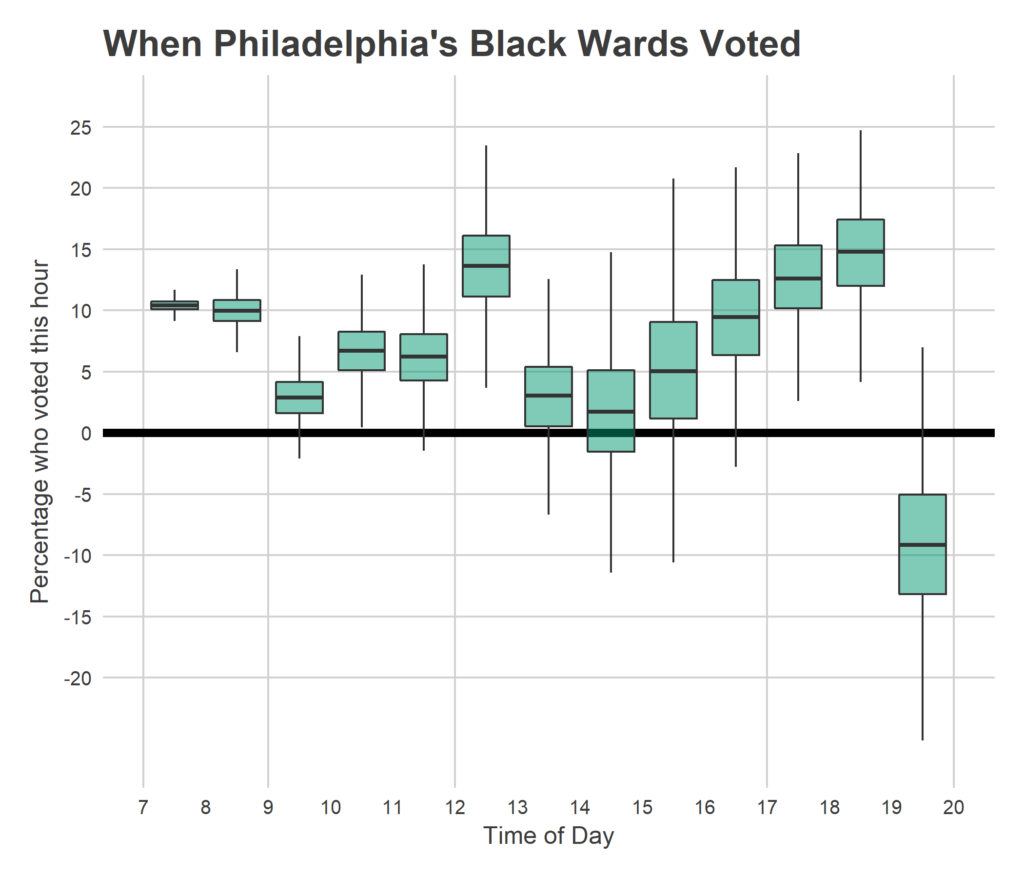
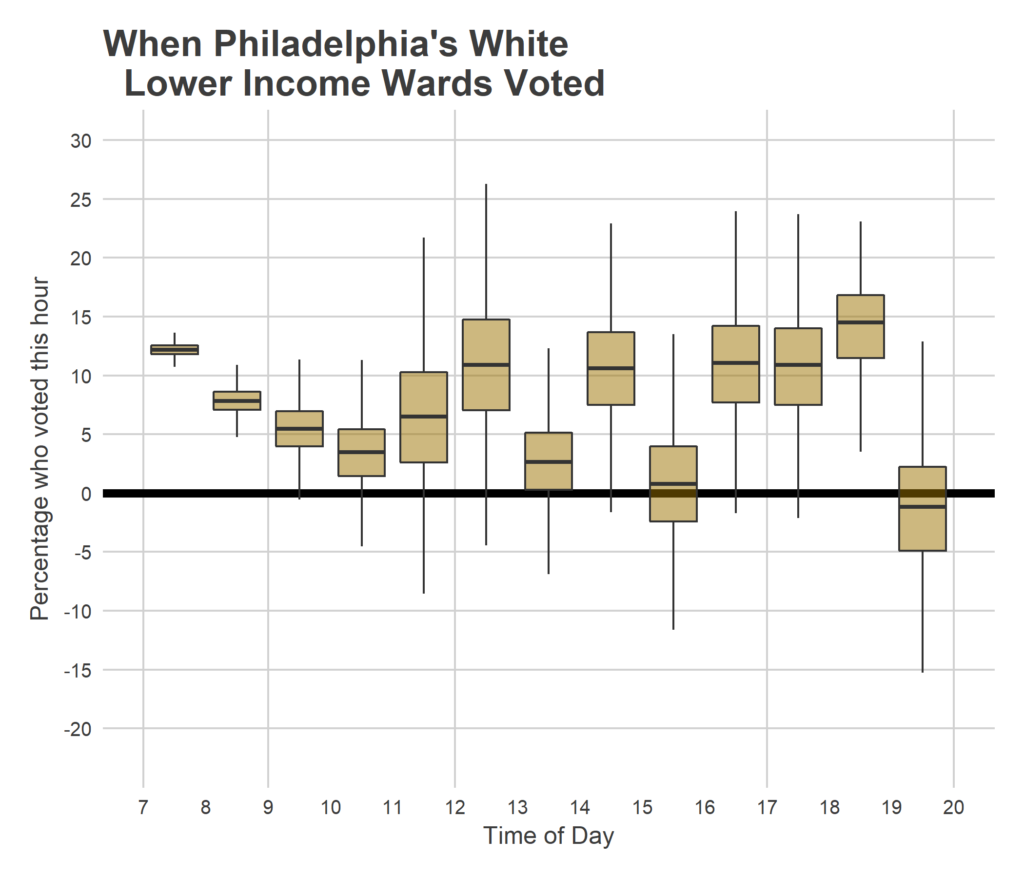
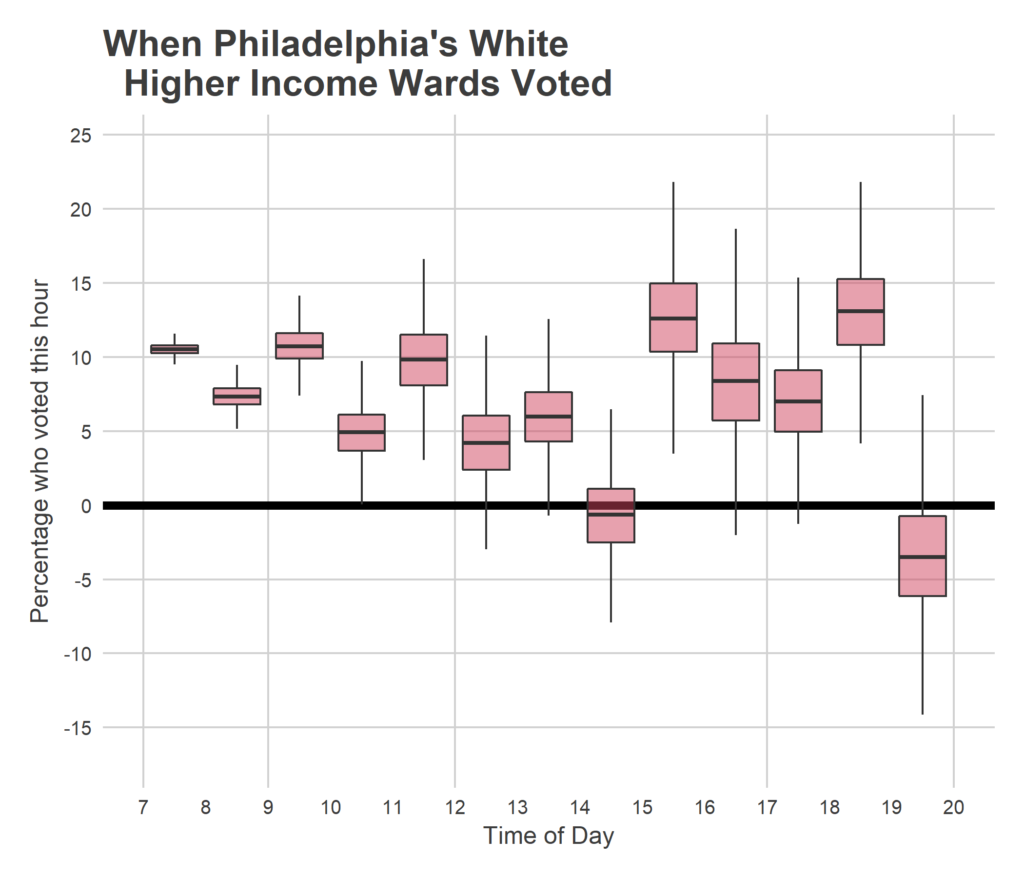
Another way to view this data is to break voting down by hour.
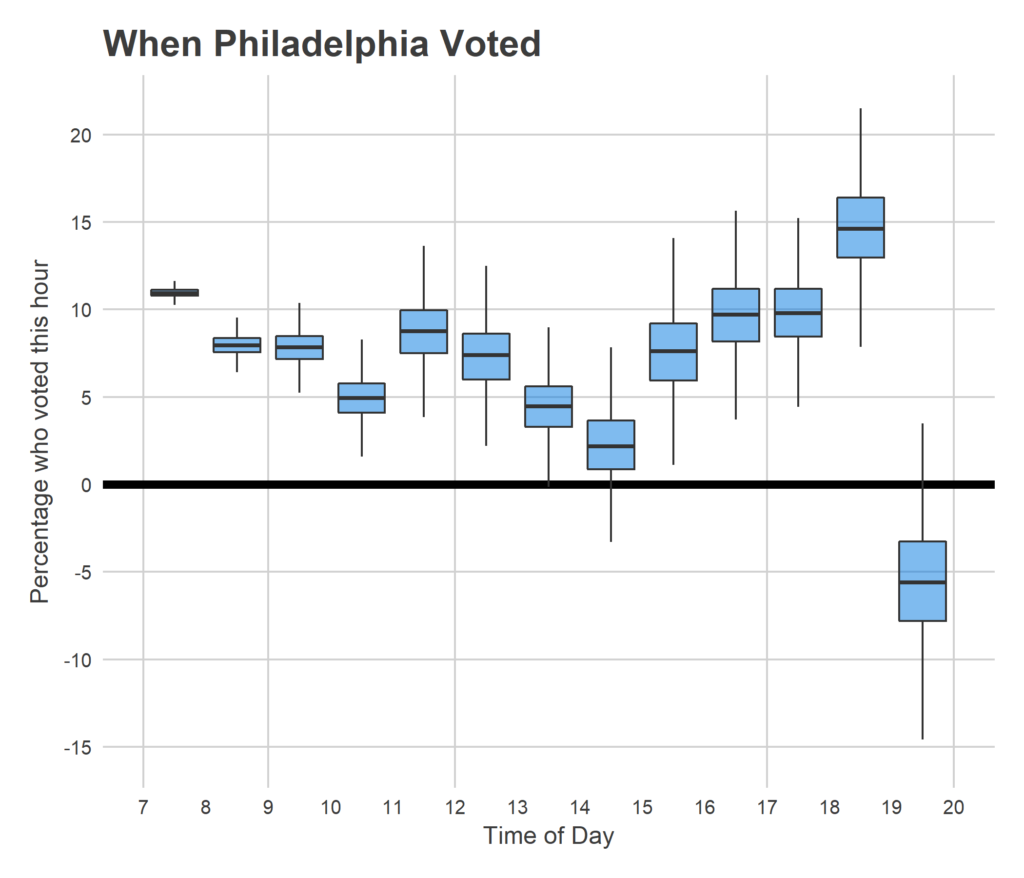
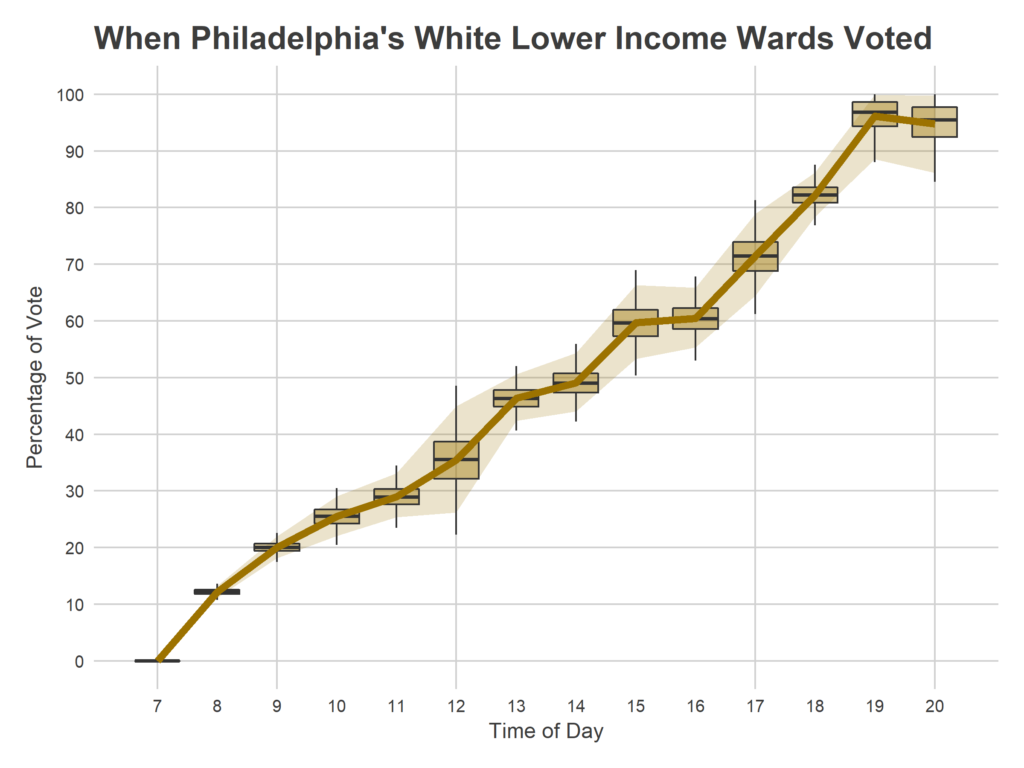
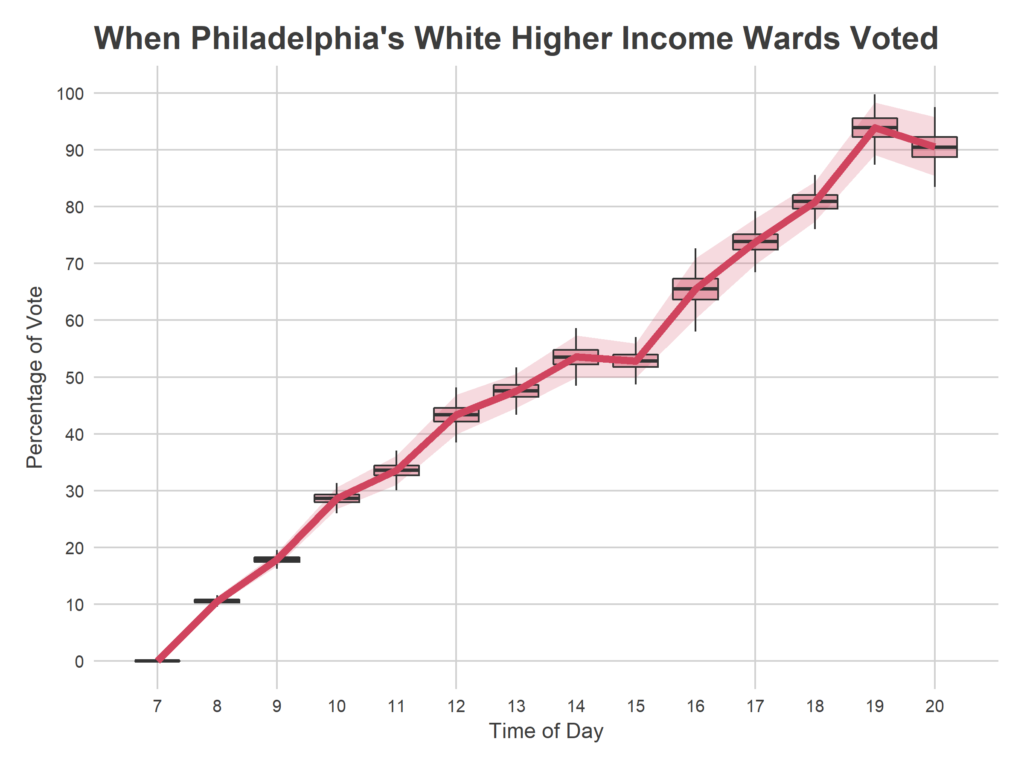
This pattern could obviously vary by neighborhood type. I don’t have quite enough data from certain parts of the city to do a fine break down, but we can get a crude idea by using Race and Income data from the American Community Survey. I group wards based on the maximum represented race/ethnicity, and whether the median household income is below or over $60,000. This gives four groups: Black under $60K, Hispanic under $60K, White under $60K, and White over $60K. I only have two data points from the Hispanic wards, but let’s look at the remaining three groups.
With that being said, here is the same model fit only within each ward group.