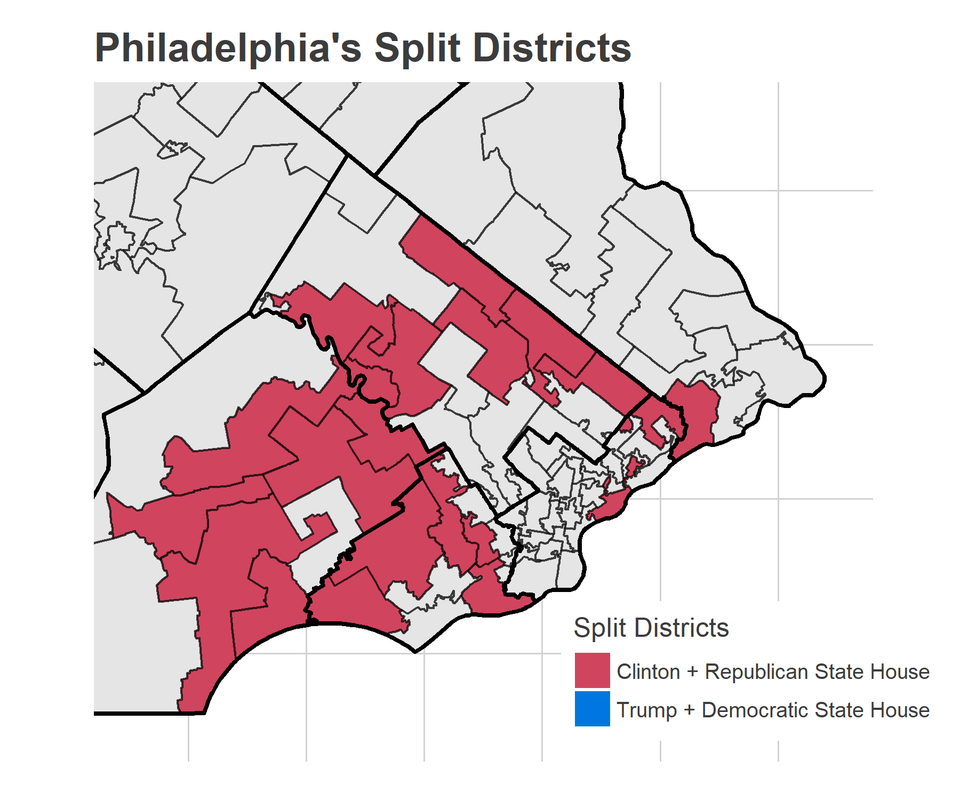
Ahead of the 2016 election, analysts predicted that Pennsylvania would come down to Philadelphia’s suburbs. Voters there had traditionally voted Republican, but swung for Obama in 2012 and were the exact well-educated, wealthier Republicans expected to be turned off by Trump’s rhetoric. Many of these districts did, in fact, vote for Clinton, but not strongly enough to swing the state in her favor.
How did these districts split?
Last week, I posted interactive maps aggregating Pennsylvania’s recent elections. I just added to them the ability to map “split districts”, in which Clinton won the presidential vote but the Republican won the local race, or vice versa.
Pennsylvania’s State House has 203 members, who are voted on every two years. In 2016, 113 Republicans and 77 Democrats won. The remaining candidates were listed on the ballot as a third party, often D/R; when they are added based on their caucus, the overall Republican House victory was 121 – 82. Republicans thus won 59.6% of the House seats; thanks to gerrymandering and asymmetric concentration of votes, they did this with only 52.7% of the total State House vote.
In the plot below, I compare each district’s vote for President with its vote for State House. Points on the diagonal line represent districts where Clinton received the same percentage of the vote as the Democratic Representative (and Trump the same as the Republican). Points to the right of the plot voted for Clinton, to the left voted for Trump. Points to the top voted for the Democratic Representative, to the bottom the Republican.
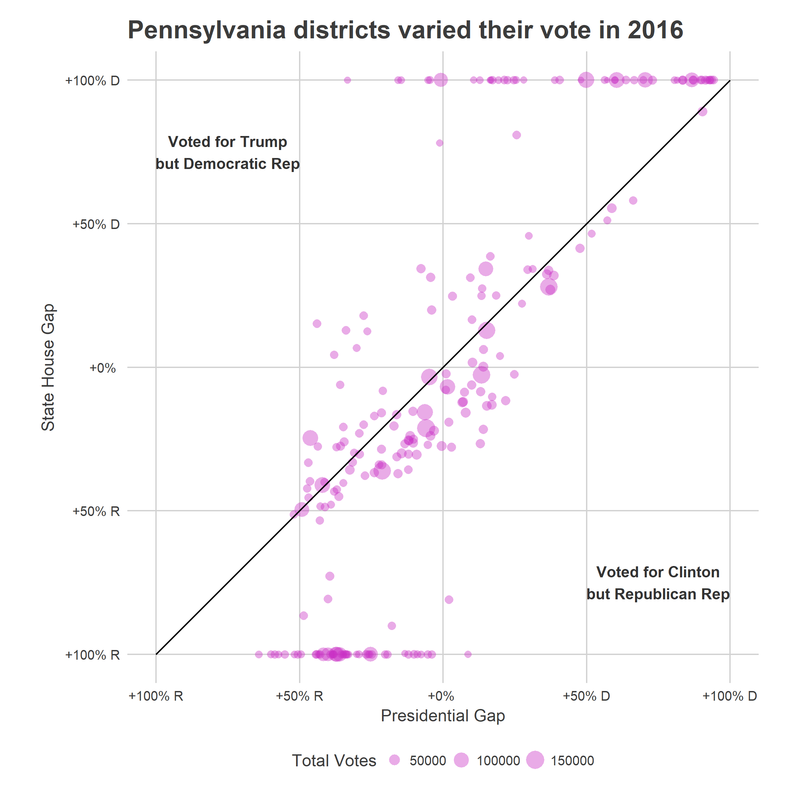
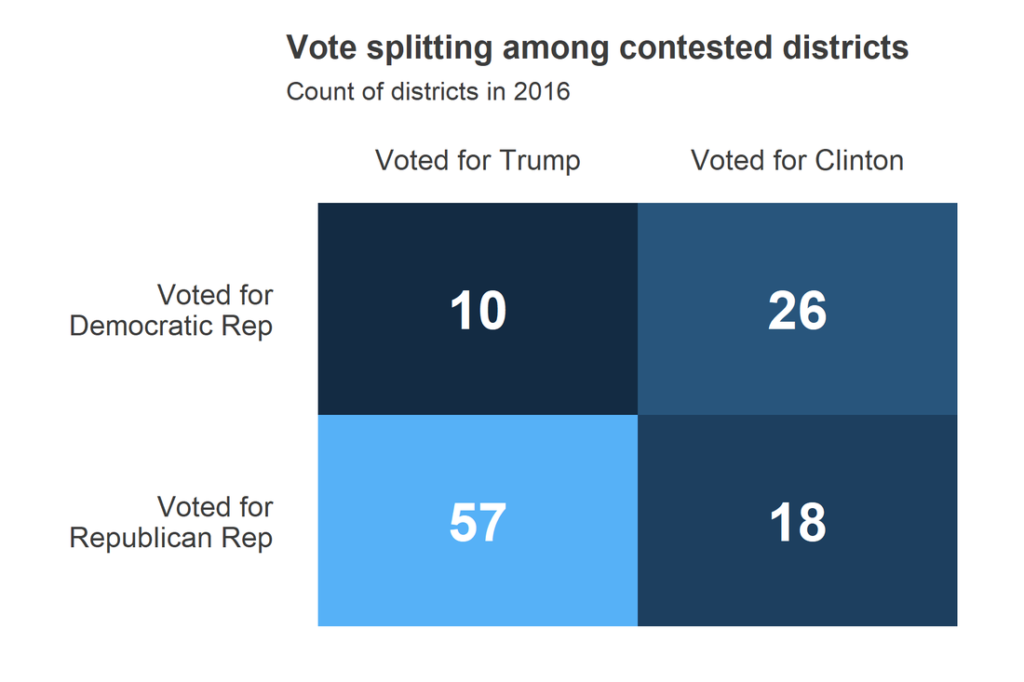
Many of these districts still elected representatives of the same party. However, the points in the top left quadrant (above the x-axis and to the left of the y-axis) and the bottom right quadrant (belowthe x-axis and to the right of the y-axis) are districts that actually elected different parties in the topline results. Some 18 contested districts that Clinton won were won by the Republican Representative, compared to 10 districts that Trump won going to Democrats.
Democrats would need to win 20 seats to take control of the State House. What should we expect from these 18 that voted for Clinton but a Republican representative? That’s an open question.
One line of reasoning is that these districts will continue to support their local Republicans. They clearly dislike President Trump, but even in 2016 that wasn’t enough for Democratic representatives to win. In 2018, when Trump isn’t even on the ballot, surely voters will continue to support their local, traditional Republicans.
On the other hand, support for Trump has set record lows for Presidential approval (only 39.5% of Americans approve as of this writing), and it appears that voters’ distaste may be spilling over to the rest of his party. As Republican officials have fallen in line behind Trump during his first year, they’ve fallen decisively behind in generic ballots, with unnamed Democrat beating unnamed Republican by 8 points. Voters in the Philadelphia suburbs may have expected Hillary to win, and voted for the Republicans they were familiar with as the Republican Party would inevitably reject Trumpism. Instead, Trump won, and his takeover of the Party may sour these voters on their local Republicans, too.
There were 34 split districts in Pennsylvania in 2016, and even more that just barely missed the cut. Democrats need to gain 20 seats to take over the house. That gap, which once would have seemed insurmountable, may be in play.