How many votes were lost due to polling place closures?
In response to the unprecedented pandemic, City Commissioners consolidated polling places ahead of the 2020 Primary. Instead of the 832 polling places in the 2019 Primary, voters were only given 188. The result is that voters in many Divisions had to travel farther to vote on Election Day (if they voted in person). How many votes did that cost us?
NOTE: I want to say up front that the City closing polling places may have been the optimal decision among bad choices. The election took place in the heart of the pandemic, and I am not claiming that there was a better strategy, with shortages of poll workers and many existing polling places not able to support social distancing. But we can, in retrospect, use the consolidation to understand the importance of polling place location, and make sure we do better in November.
Data note 1: I’m filtering out Divisions whose boundaries have changed since 2019.
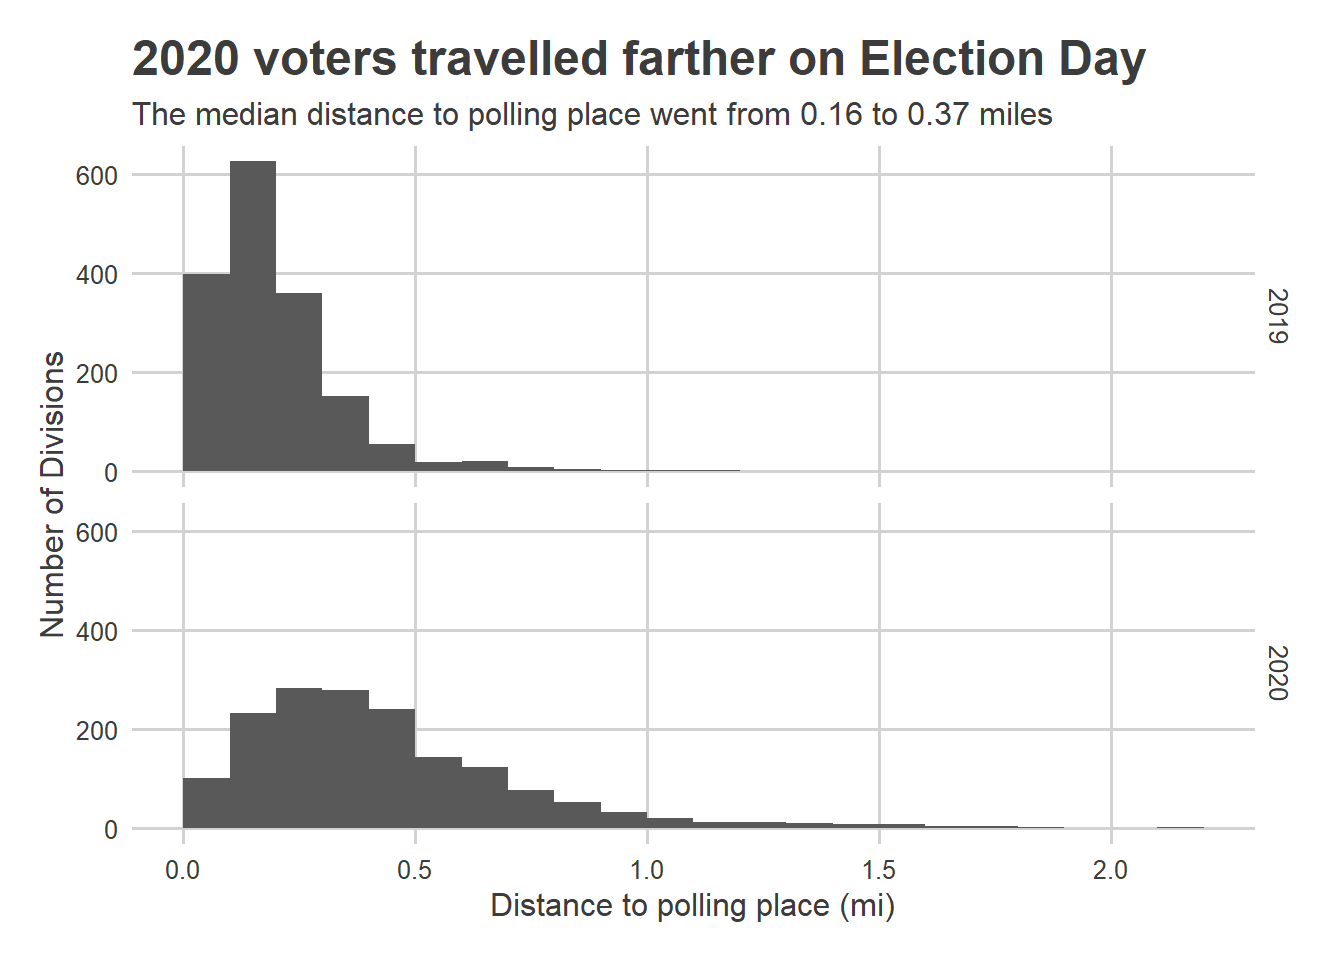
The median distance from a Division’s centroid to its polling place more than doubled this election, from 0.16 miles in the 2019 Primary to 0.37 in 2020.
What happened to turnout in places where the distances greatly changed?
Data note 2: I compare distance to polling place in 2020 to that of 2019, but will compare turnout in 2020 to that of 2016. Because polling places were very stable over time until this year, that’s not a big deal. To whatever extent the distances in 2016 were different from 2019, that’ll cause attenuation in my estimates, meaning the turnout changes due to distances are actually larger than what I state.
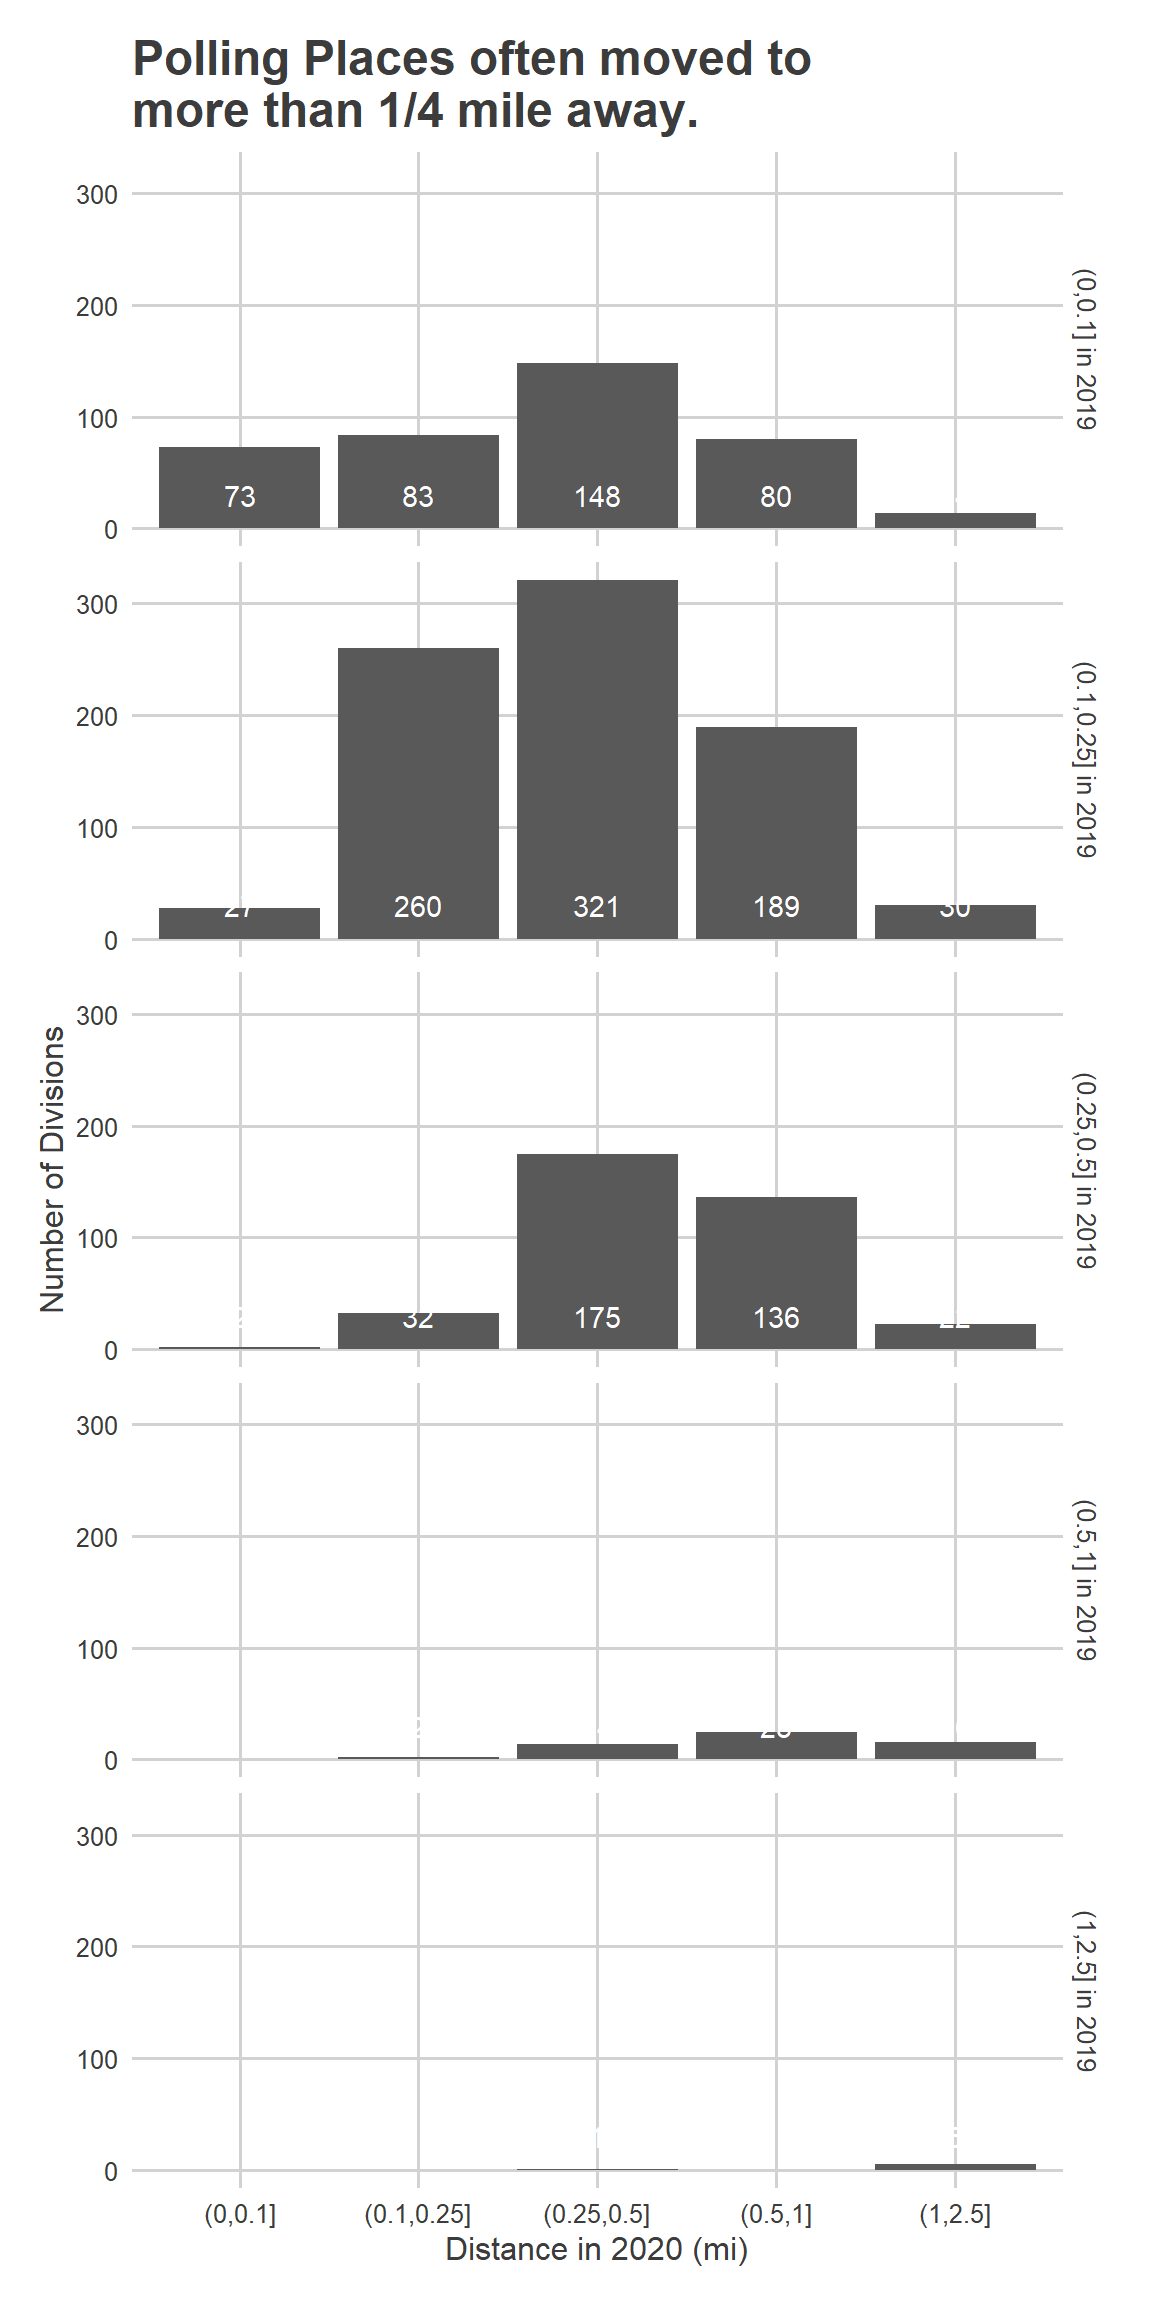
First, how far did polling places move? The most common distance in 2019 was between 0.10-0.25 miles, comprising 827 Divisions. Among those, 540 had their polling place moved to more than a 0.25 mile distance in 2020. In total, of the 1,655 Divisions I’m considering, 1,304 had to travel farther in 2020 than in 2019, and 660 had the distance increase by more than 1/4 mile.
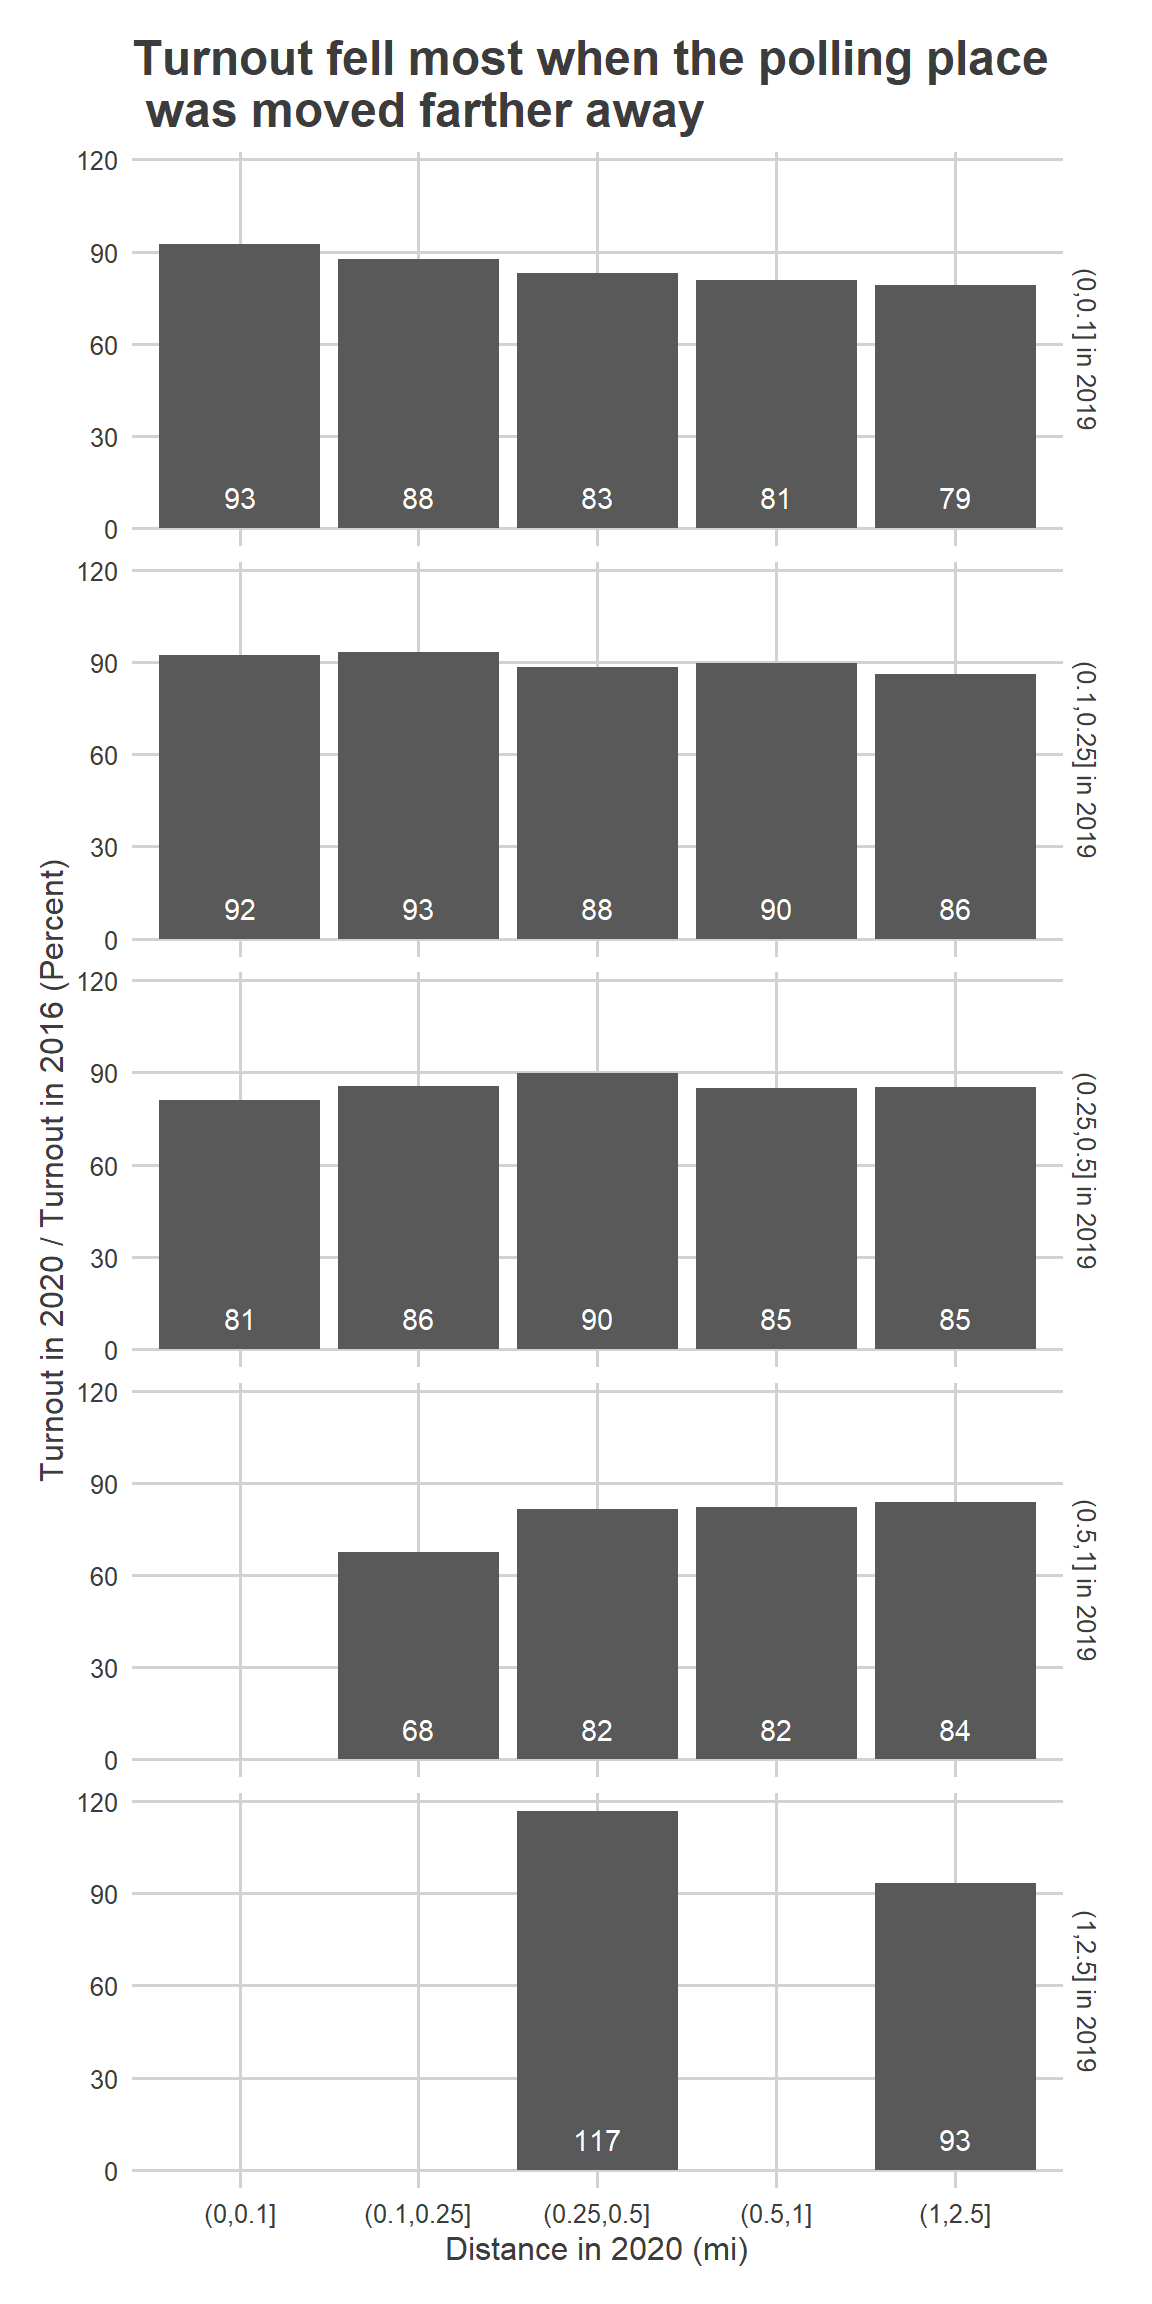
Among Divisions that were close to their polling place in 2019, there was a fall-off in voting when they were moved farther away in 2020. For example, among Divisions that stayed within 0.1 miles in both 2019 and 2020, 2020 turnout was 93% of 2016. But among the 148 Divisions that moved from within 0.1 mile away to only within 0.5 miles away, turnout was 83% of 2016 turnout.
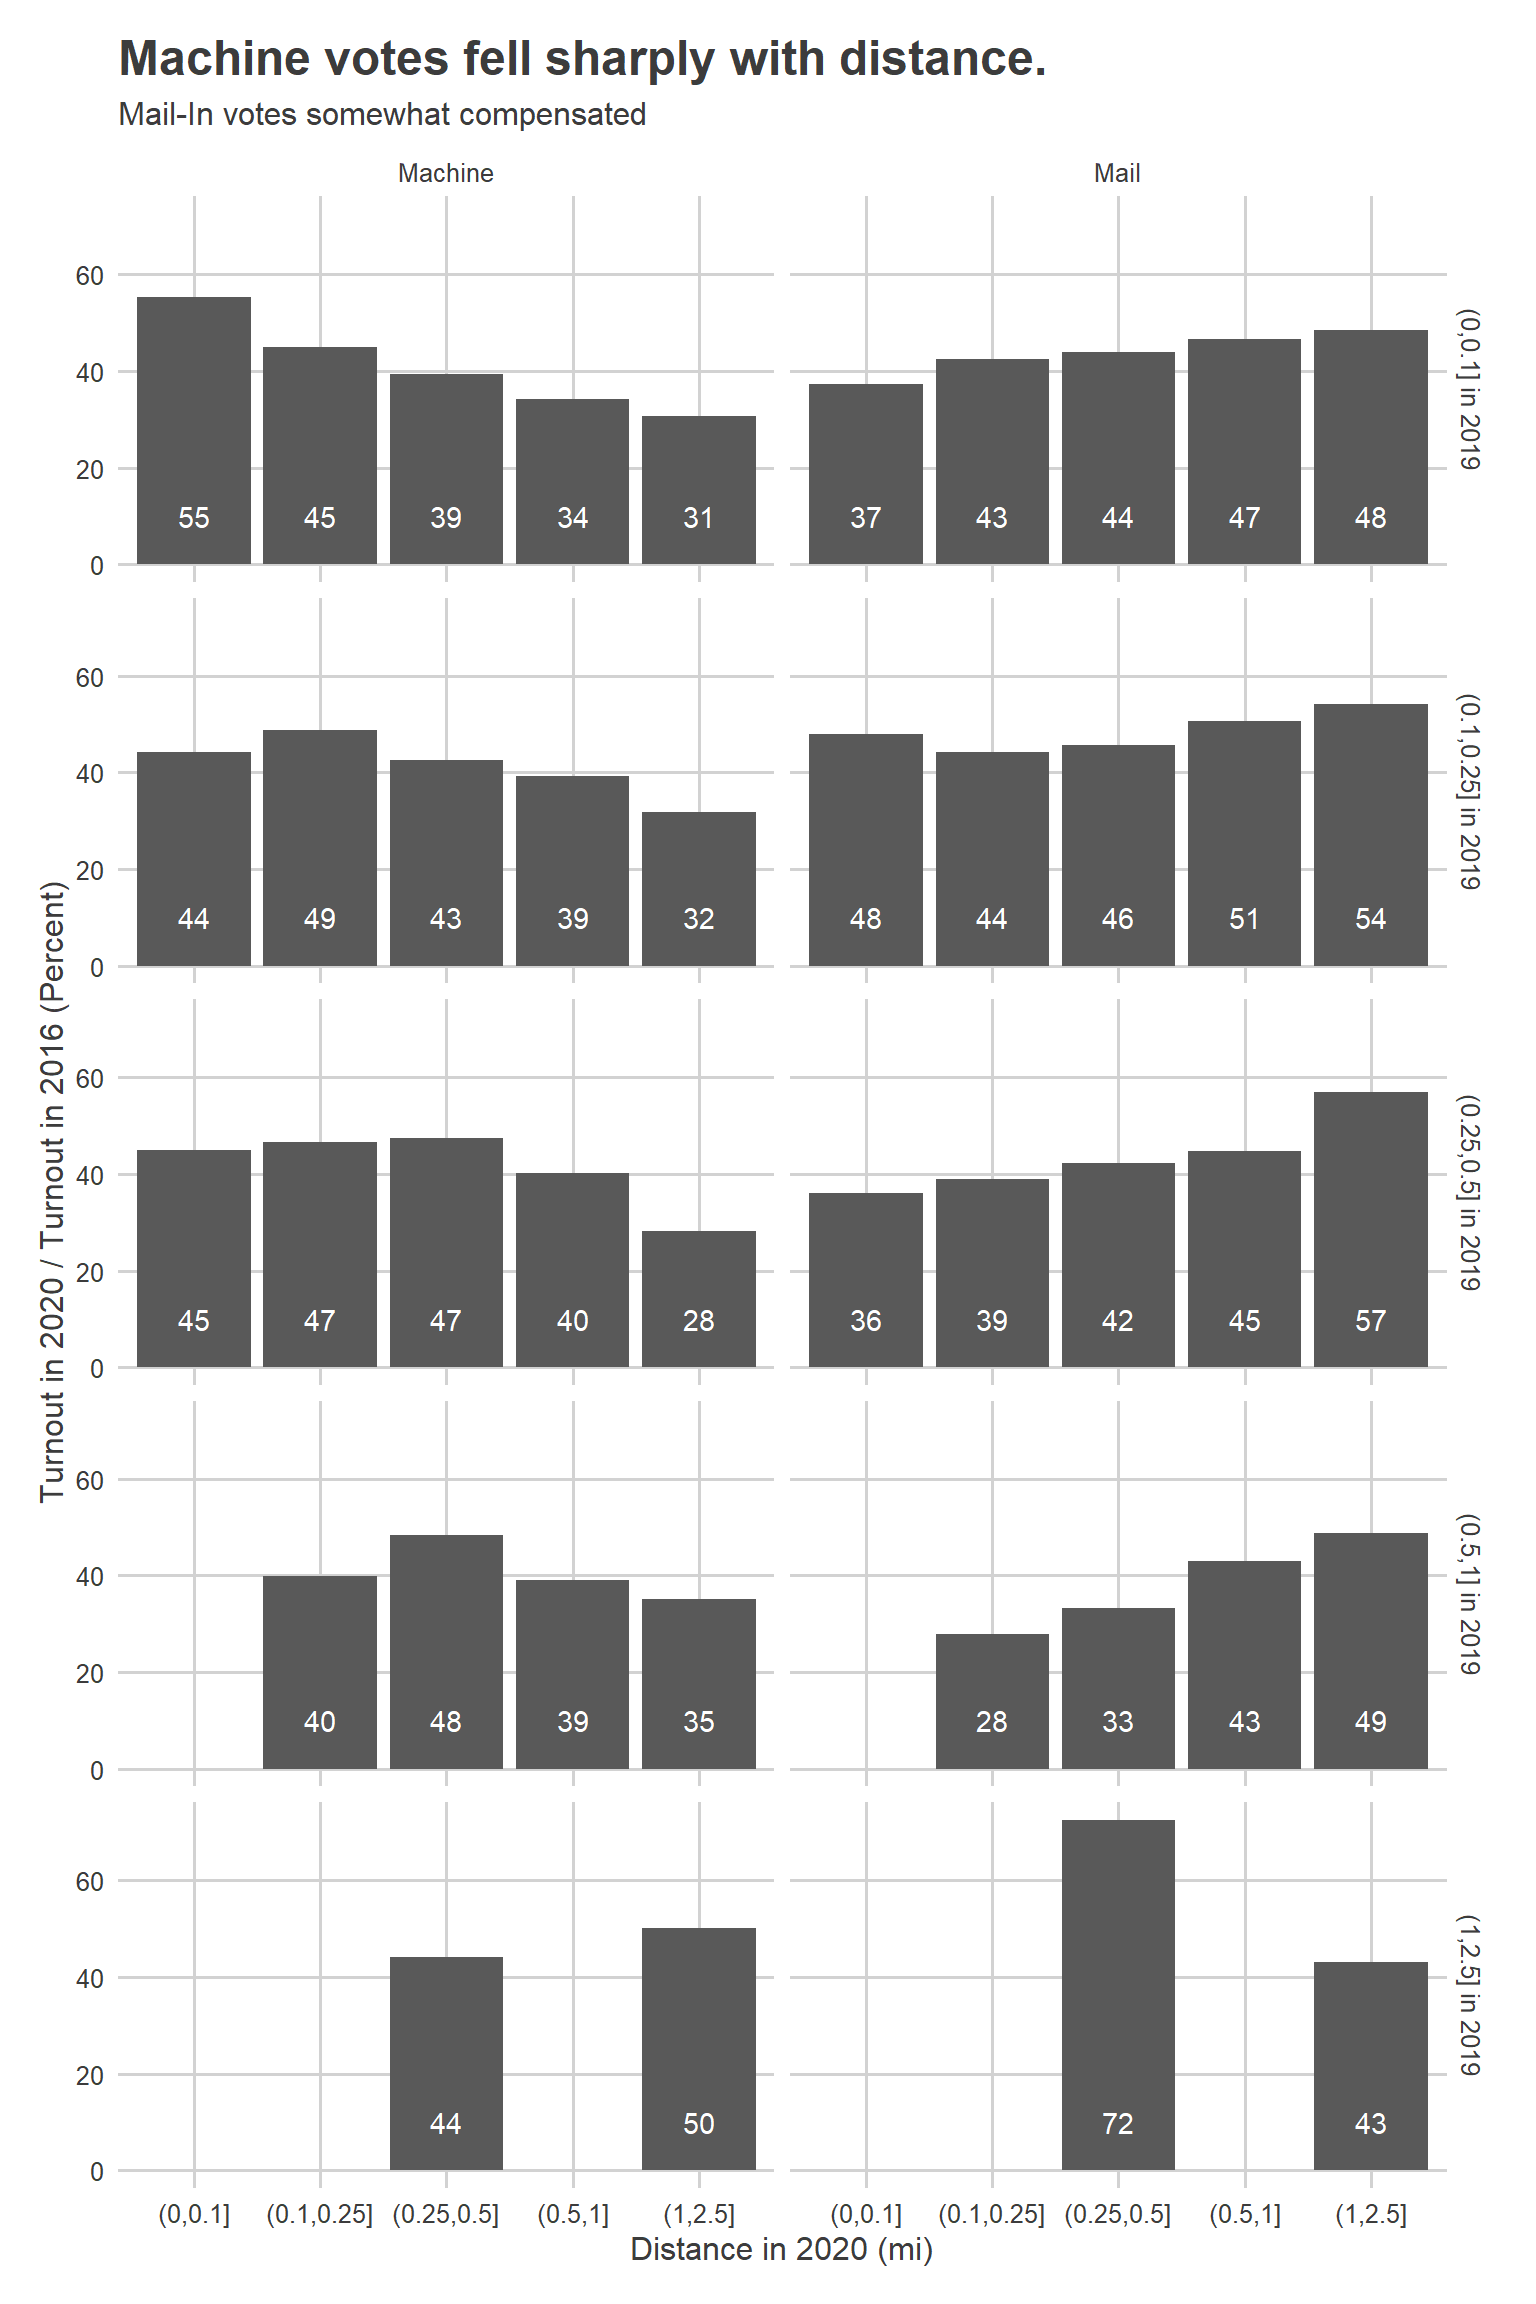
That fall was smaller than it could have been, and was mitigated by voters strategically using mail-ins. Among the Divisions that moved farther away, in-person voting fell sharply, but mail-in voting rose to somewhat counteract the decline. Among the Divisions that stayed within 0.1 miles, for example, in-person turnout was 55.2% of 2016 turnout, and mail-in votes were 37.4% of 2016 turnout (giving the 93% from above). But among those that moved from within 0.1 miles to within only 0.5 miles, in-person turnout was 39%, and mail-in only rose to 44%.
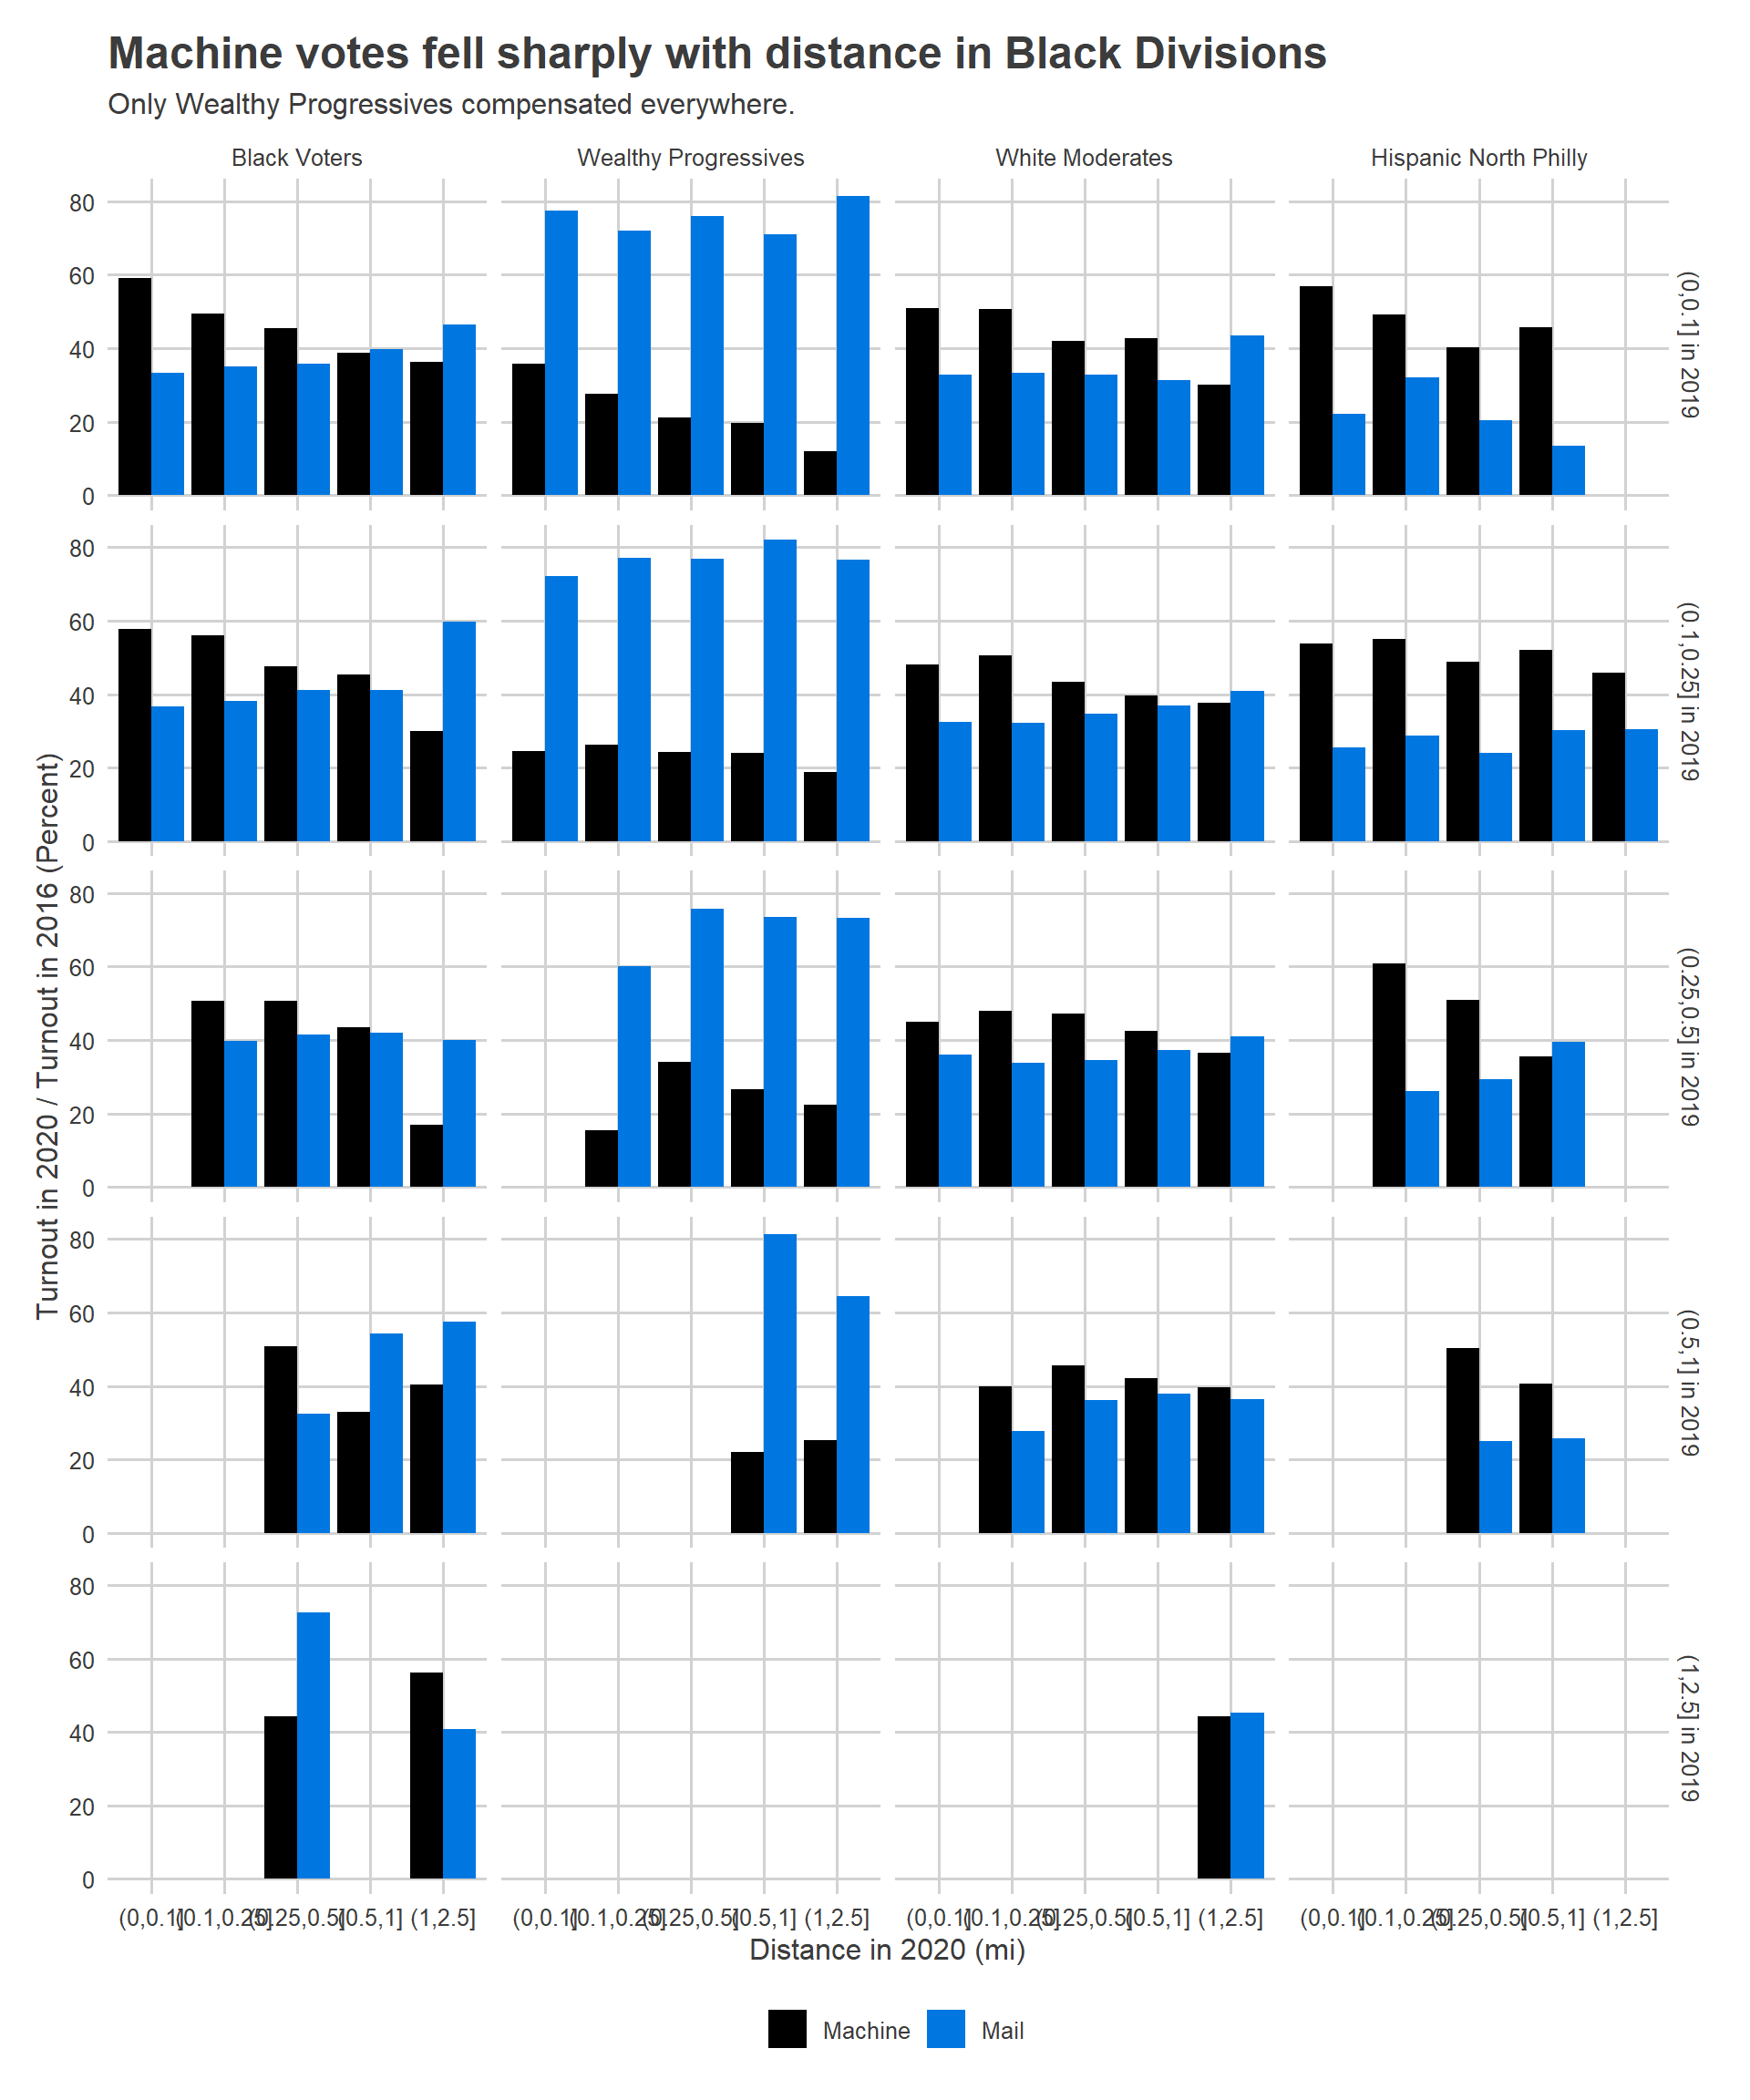
I’ve shown before that mail-in voting had strong differences by voting bloc. And those played out sharply in how distance changed turnout.
Black Voter Divisions showed the strongest fall-off when Divisions were moved farther away, with some evidence of mail-in mitigating the gap. Wealthy Progressives also showed some fall-off, though they heavily used mail-in voting everywhere. Hispanic North Philly Divisions, on the other hand, showed the lowest use of mail-in ballots (Notice that this is even as a fraction of 2016 votes! And in 2016 they were already among the lowest turnout.)
There are two important things that the above analysis doesn’t account for: differences in where races were competitive, and uncertainty. To explore that, I fit a regression with state house district fixed effects, and bootstrap the polling places to provide clustered uncertainty.
The plot below shows the percentage point difference in (turnout 2020 / turnout 2016) between a Division in a given distance bucket and the Divisions that were in the (0,0.1] bucket in both 2016 and 2020.
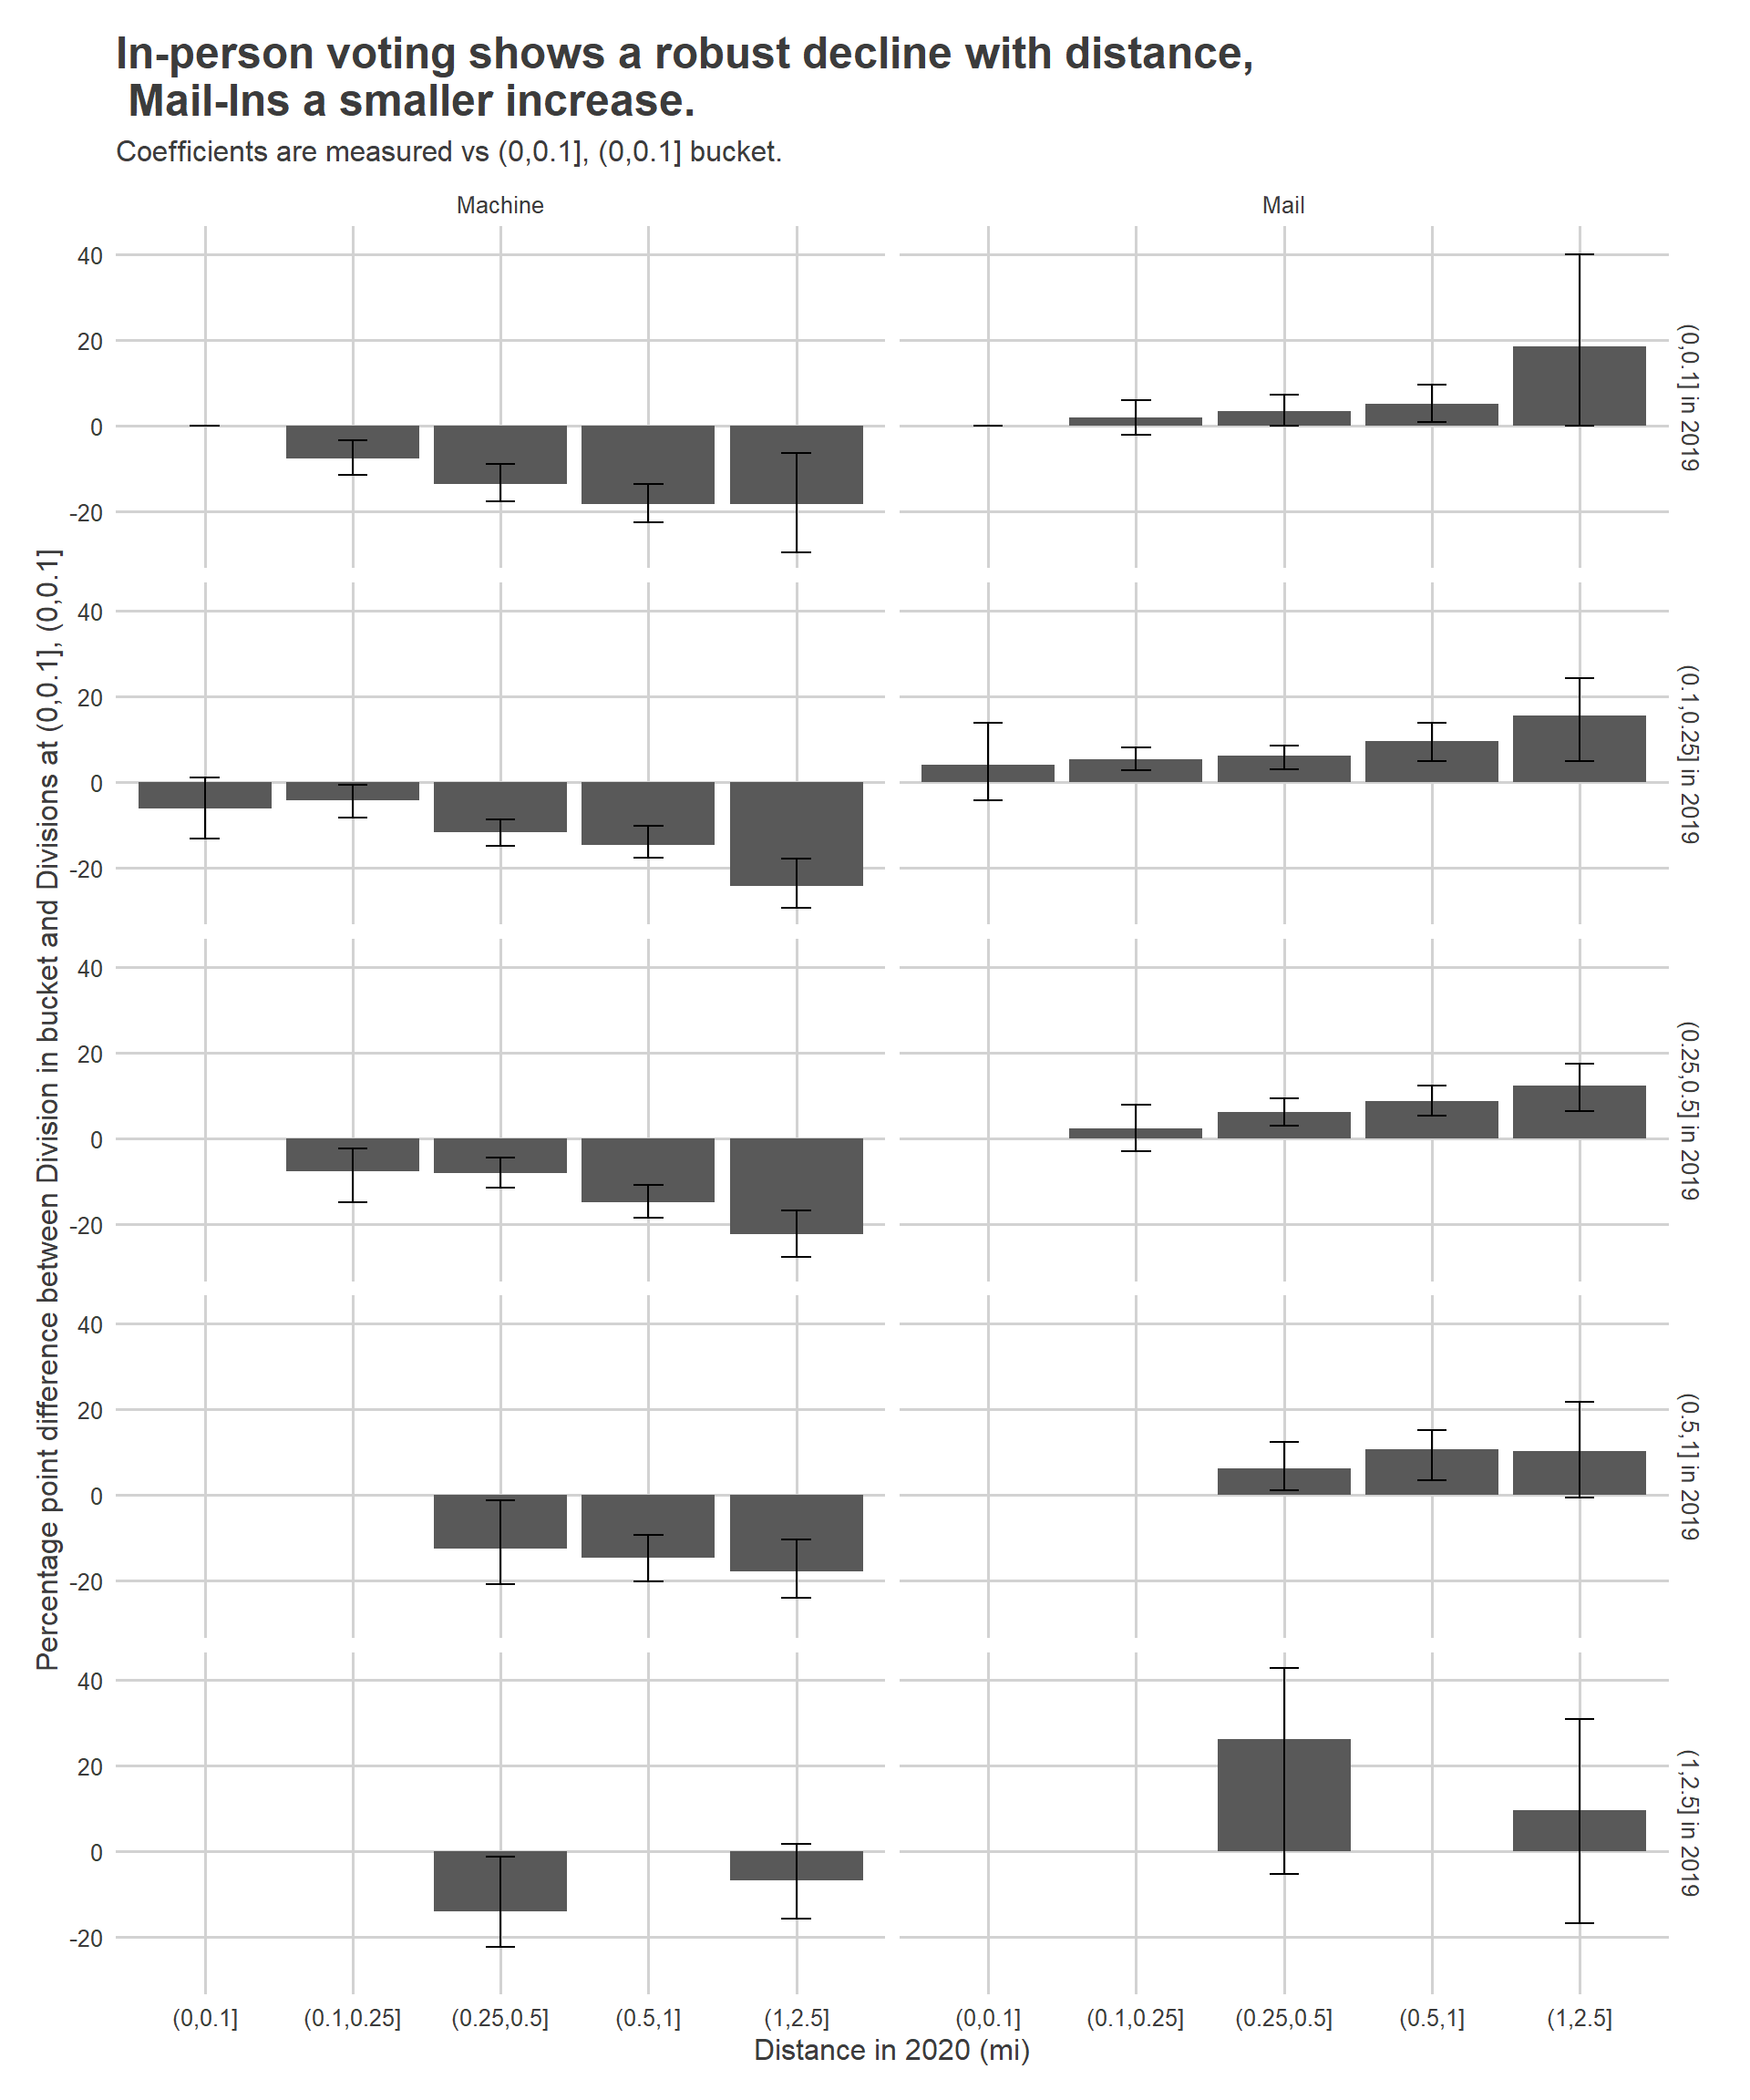
For example, a Division that was within 0.1 miles in 2016 but moved to within only 0.25 miles in 2020 saw in-person turnout (relative to 2016) 7.7 percentage points lower than a Division that stayed at 0.1 miles.
There are two caveats with this analysis. First, using fixed effects means I can’t differentiate by voting bloc; there aren’t enough districts with multiple voting blocs in them. Second, it assumes that the Commissioners were not anticipating which Divisions would vote disproportionately and choosing the exact placement of the polls accordingly. This strikes me as a reasonable assumption, controlling for state house district, but I can’t prove it.
So how many votes did moving polling places cause? For each polling place, I calculate what the votes would have been using the 2019 distance, instead of the 2020 distance. (This assumes full causality of the coefficients. For instance, it assumes that in no way were the polling places moved in anticipation of how votes would disproportionately fall.)
Among the Divisions we’re considering, there were 378K votes in the 2016 primary, and 332K votes in the 2020 primary (mail-ins and in-person combined). Moving each Divisions to its 2019 distance, we would have seen 351K votes (with a 95% confidence interval of 340K-365K).
Looking ahead to November
Who knows what Covid-19 will look like in November. We may be in the heart of a second wave, and voting in person may bear significant risk. But closing polling places costs votes. It’s incumbent on us to figure out how to keep as many polls open, and to increase the use of mail-in voting to help voters better adapt to a sparse polling place world.