I’ll dig into the tracker in another post, but let’s do a quick hit of the actual final turnout and some maps.
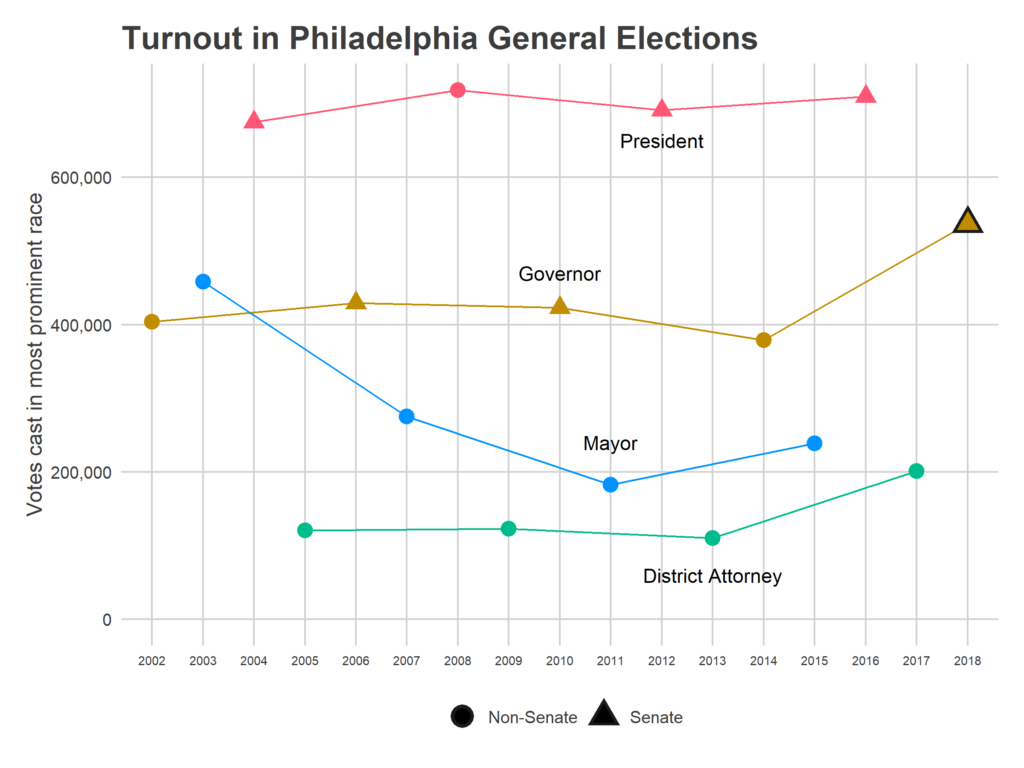
* Quick Note: In everything below, I use the votes cast for President/Governor, rather than actual turnout. This will be short by however many people leave that race blank, which appears to be < 1% of voters in past years. These results are also preliminary, representing only 99.5% of precincts.
And Philadelphia somewhat outpaced the rest of the state, where votes grew by 41%. So not only did turnout surge, but Philadelphia eked out some more statewide clout, too.
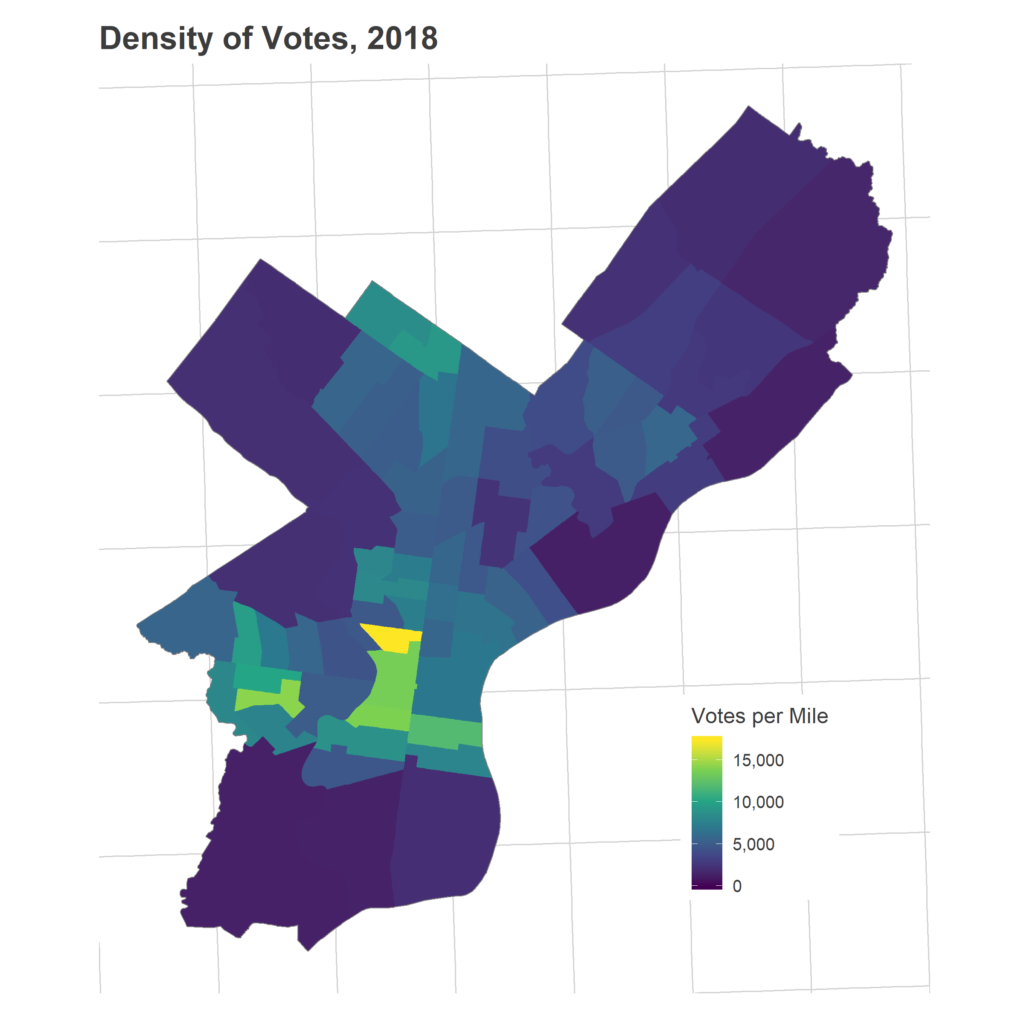
Where the votes came from
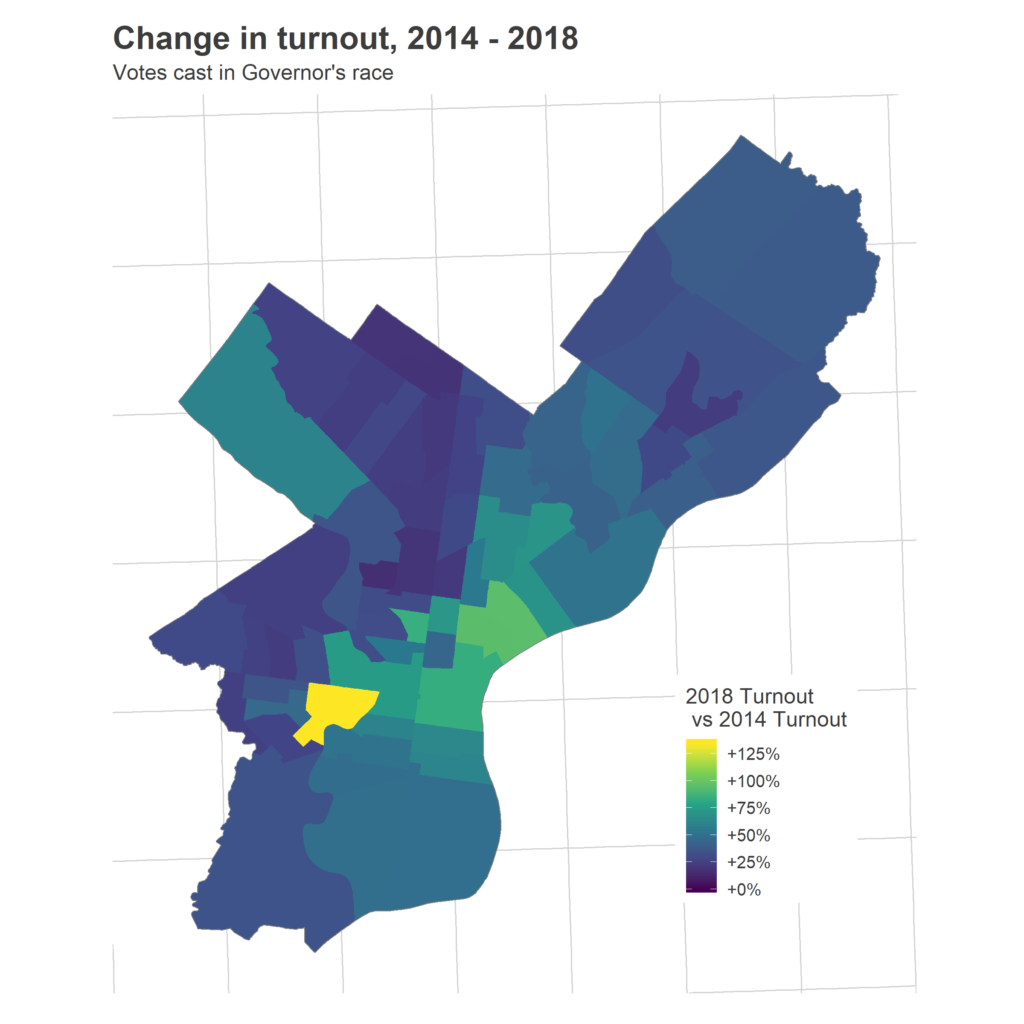
The turnout boom was not evenly distributed. As we saw in 2017, it was driven by the wealthier, predominantly white wards, and especially those that have gentrified over the last twenty years.
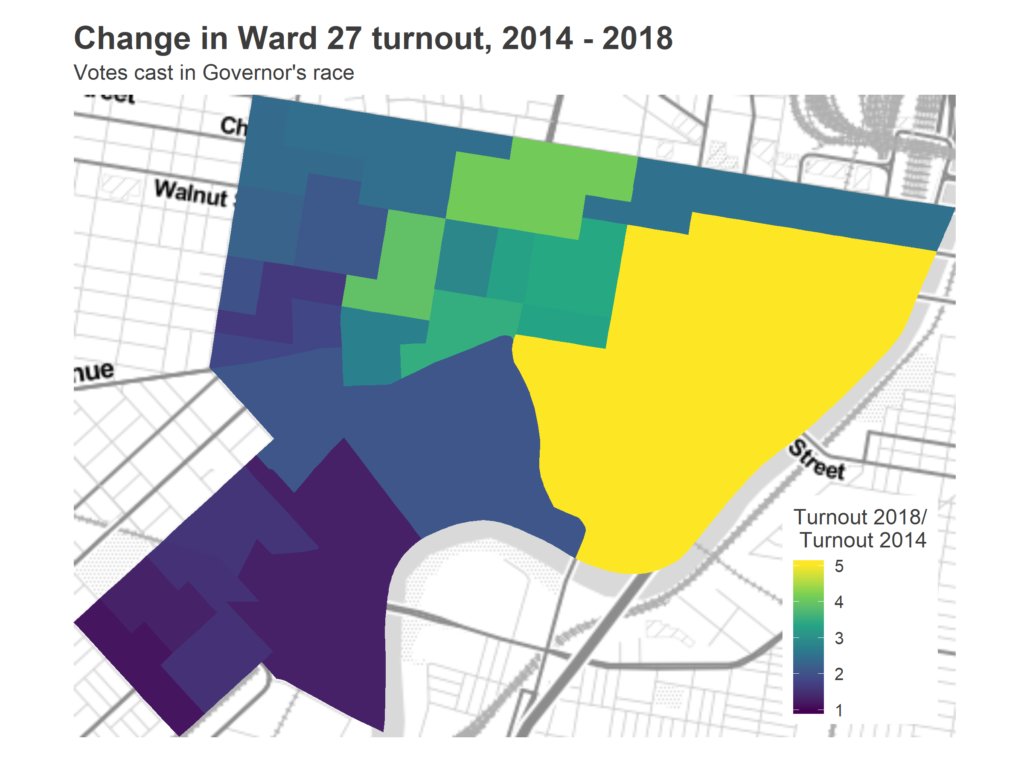
Immediately in the morning, the Tracker made one thing clear: Ward 27 saw the biggest turnout growth. It ruined the color scale on the map.
This is worth digging into more. How did a ward possibly see this much growth? It’s all Penn. The division right along the river, containing most undergrad dorms, went from 116 votes in 2014 to 585 in 2018. That manages to make the second and third place divisions look a weaker green, even though they quadrupled(!!) their votes, from 88 to 363 and from 82 to 322, respectively.
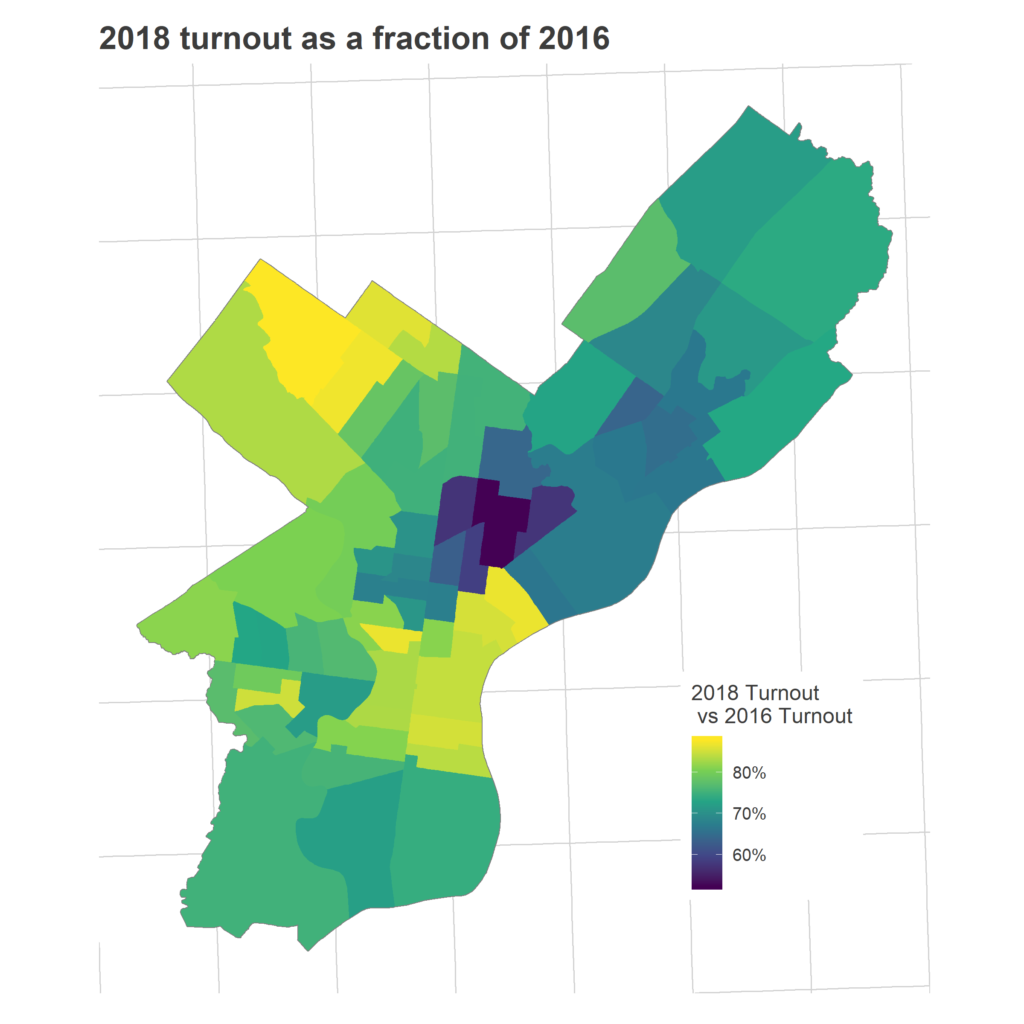
As evidence, consider instead 2018 votes as a fraction of 2016. I like this comparison, because the Presidential election of 2016 probably represents the highest plausible attainable turnout for a midterm; you’re just never going to get someone who doesn’t vote for President to vote for Governor.
Meanwhile, many of the Black wards that always come out in midterms continued to do so, including in Overbrook and Wynnfield in West Philly, and in Cedar Brook and West Oak Lane in the Northwest. These wards didn’t see their turnout grow a ton, mostly because they always, always vote (at least relative to the rest of the city).
Many of the divisions in Ward 31 to the North saw triple the 2014 turnout, whereas divisions in Ward 18 below it merely doubled.
[Edited: My map was incorrectly handling new division 18-18, so I’ve removed it until I have a fix].
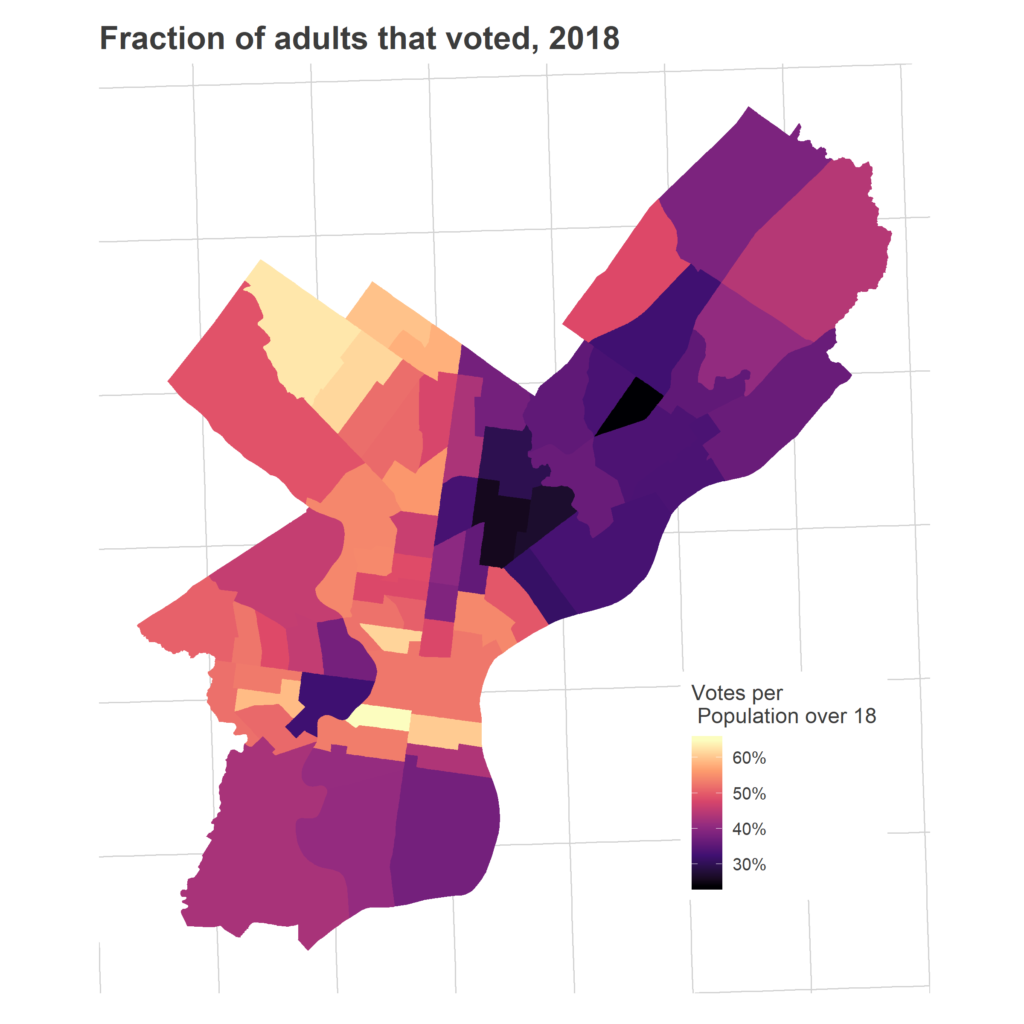
Sadly, one demographic has been under-represented in every single map in today’s post: the Hispanic communities in North Philly. For example, Ward 7 is the darkest ward in the map of 2018 vs 2016, meaning that despite its 63% vote growth over 2014 (11th best growth in the city!), it still had the worst turnout relative to 2016: only 52% of the votes from 2016 came out for 2018. This community already has the lowest turnout in Presidential races, but it shrinks even farther in non-Presidential elections.
Two straight elections of something different
Philadelphia’s turnout since 2016 has been astounding. Across the city there were 43% more votes than four years ago, and every single Ward’s turnout grew.
While voters always come out in Center City, Chestnut Hill, Overbrook, and Cedar Brook, we saw unprecedented booms in Fishtown, University City, the rest of the neighborhoods ringing Center City.
These changes have now stuck around for two straight elections–2017 and 2018–and could presage a fundamental change in our city’s political calculus for years to come.