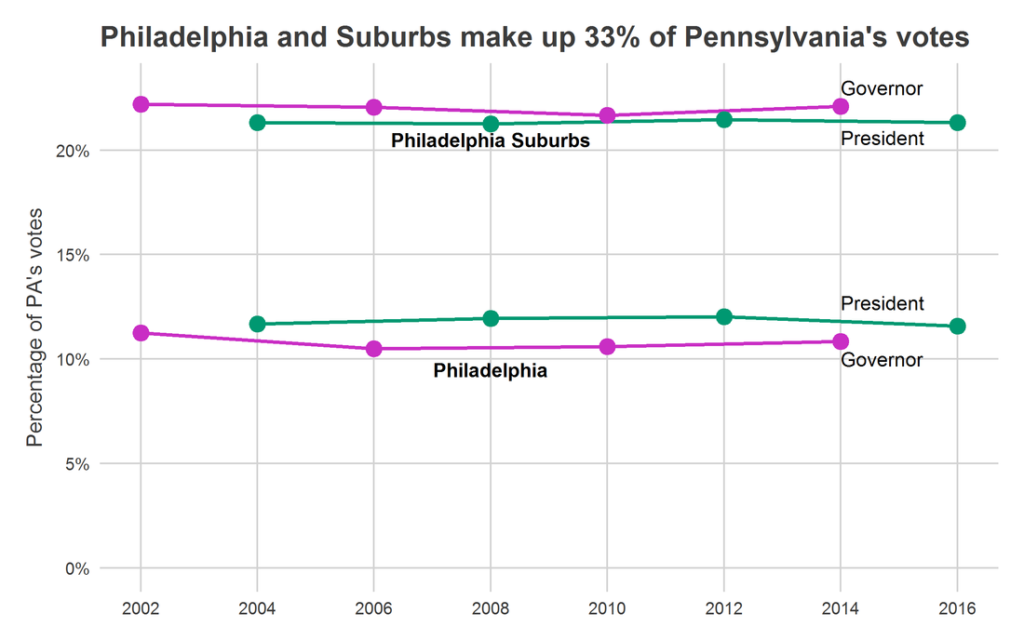
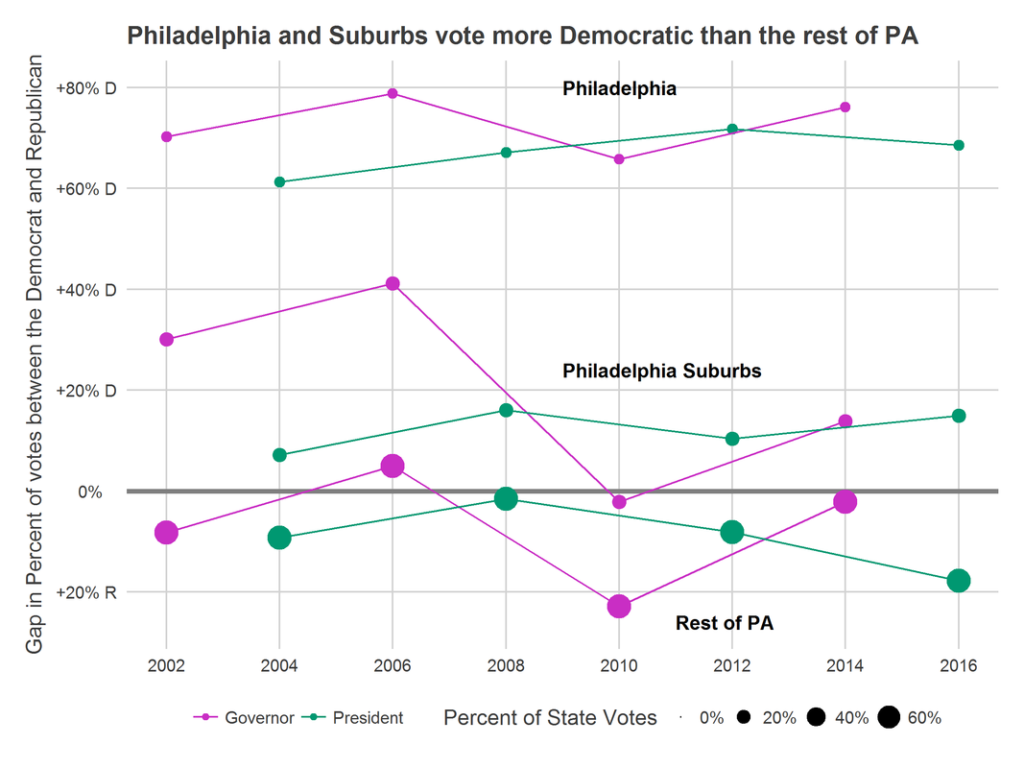
Within swing-state Pennsylvania, Philadelphia plays the role of Democratic bastion. Elections often boil down to two questions (1) how do Pittsburgh and Philadelphia’s suburbs swing between parties, and (2) can Philadelphia’s turnout overcome those swings.
I’ve downloaded data from the *amazing* Open Elections Project. Let’s look ahead to November.
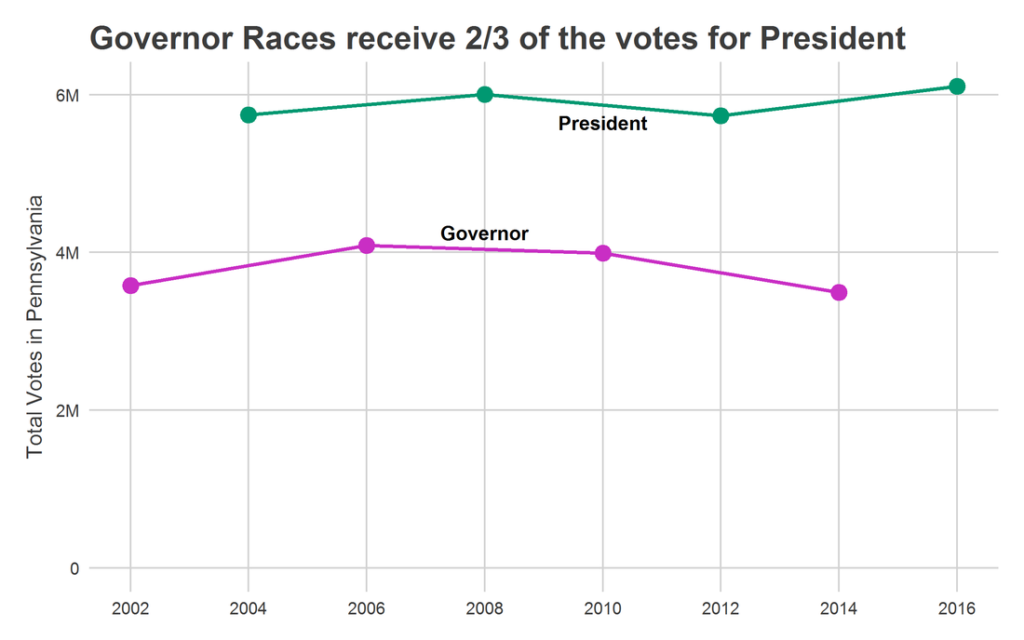
Turnout in PA Governor races is typically 2/3 of the turnout in Presidential elections. Just under 6 Million votes are typically cast for President, while under 4 Million are cast for Governor. This means that there is significant room for growth in 2018 turnout with an energized electorate.
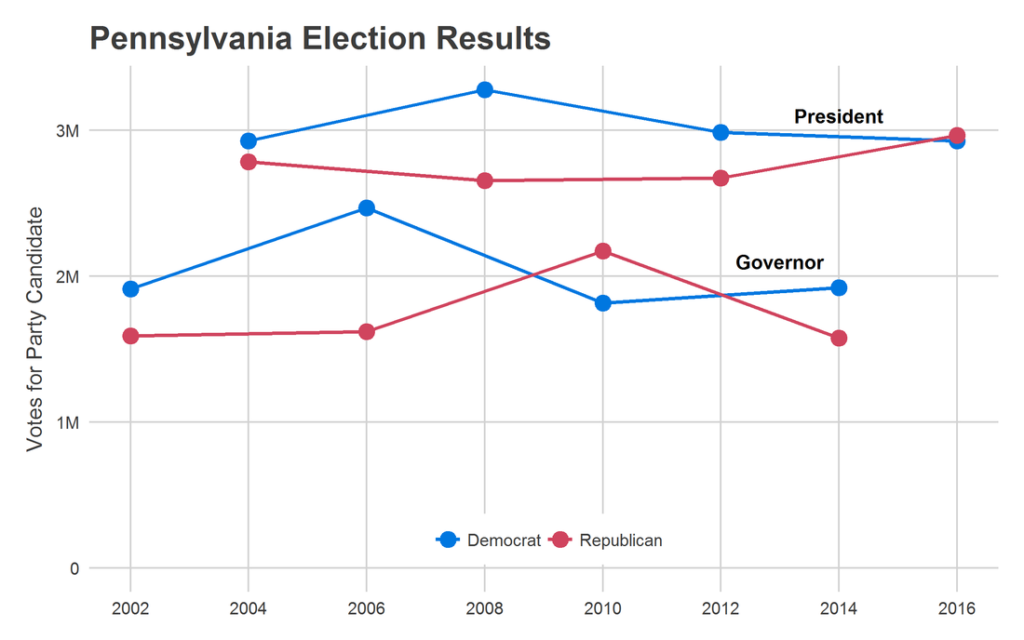
The closest proxy for 2018 is probably 2006: in that year, an unpopular Republican President and an incumbent Democratic Governor led to a sweeping victory across the state, with Ed Rendell winning reelection by 19.8 percentage points. Coincidentally, Bob Casey was running then as now, and this wave carried him to a 17.4 point win over incumbent Rick Santorum.
That election also saw the highest statewide turnout for a Governor’s race, with 4.1 million Pennsylvanians voting. Democratic voters in 2018 appear to be even more motivated than twelve years ago; if turnout closes even a fraction of the 2 Million vote gap between Presidential and Gubernatorial races, we could expect record vote counts.
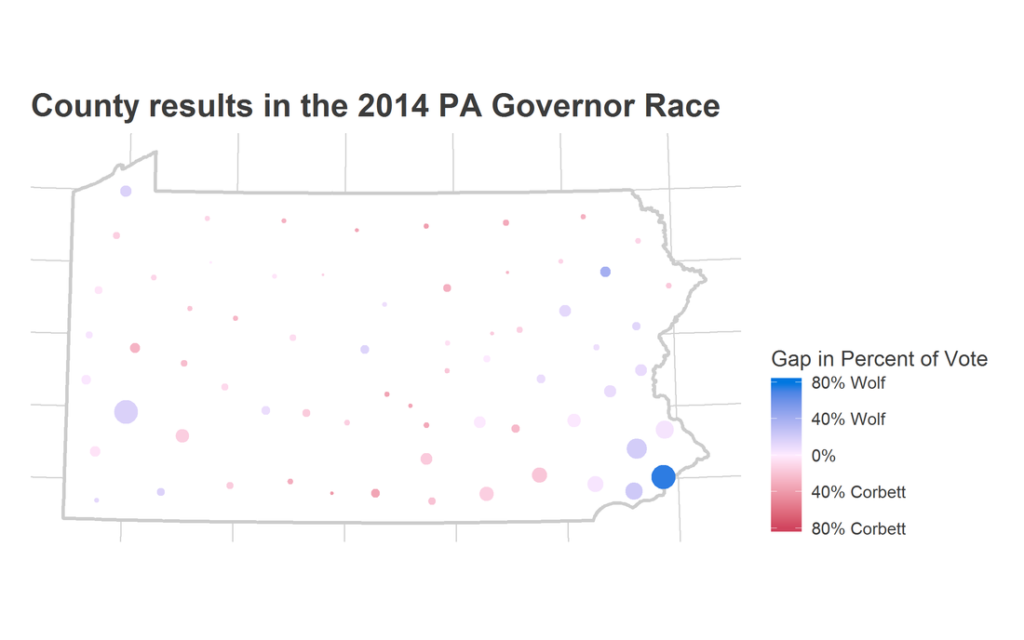
In a previous post, I decomposed swings in votes into changes in turnout and changes in party selection. Let’s apply that same calculation to state, county by county.
A recap: the calculation decomposes each county’s effect on the statewide election results into the effect of its turnout swings and of swings in its party preference. If a county has a score of 0.2 in Party Variability, that means that its typical swing in party preference changes the statewide election outcomes by 0.2 percentage points. If a county has strong average turnout but varies in which party it votes for, it will have a high Party Variability score. If a county always votes for one party, and its turnout varies from election to election, it will have a high Turnout Variability score. Counties that always have low turnout or don’t vote strongly for a given party will have low scores, as will counties that never vary.
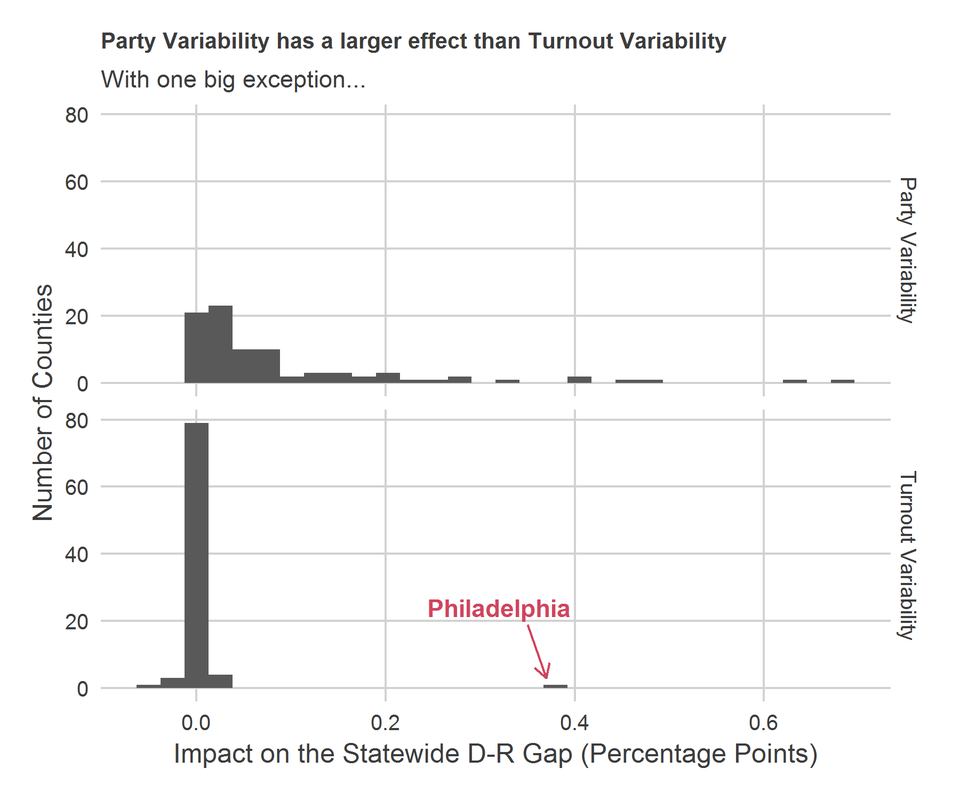
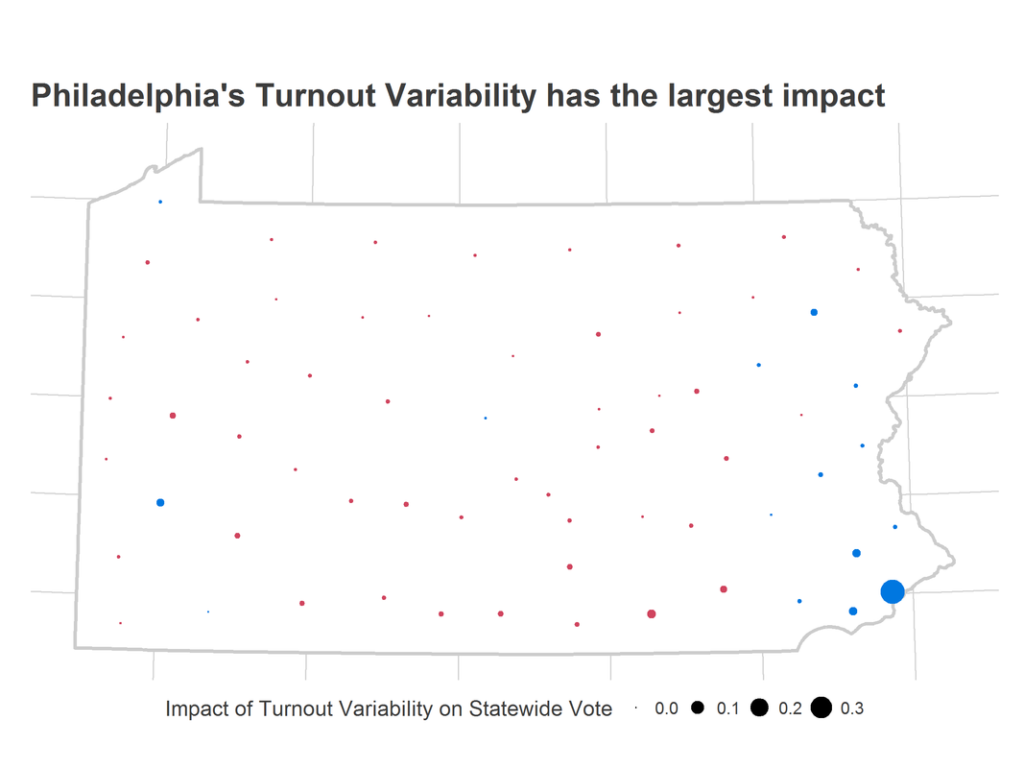
(Note: This calculation focuses on county-level results, and I don’t have data on individual voter turnout. Some of the Party Variability is almost certainly within-county turnout differentials: if within a county the Republicans are more likely to vote than the Democrats in a given election, that will appear in this calculation as a change in that county’s party preference. As such, this calculation almost certainly overstates Party Variability and understates Turnout Variability. Nonetheless, Philadelphia’s larger score is telling.)
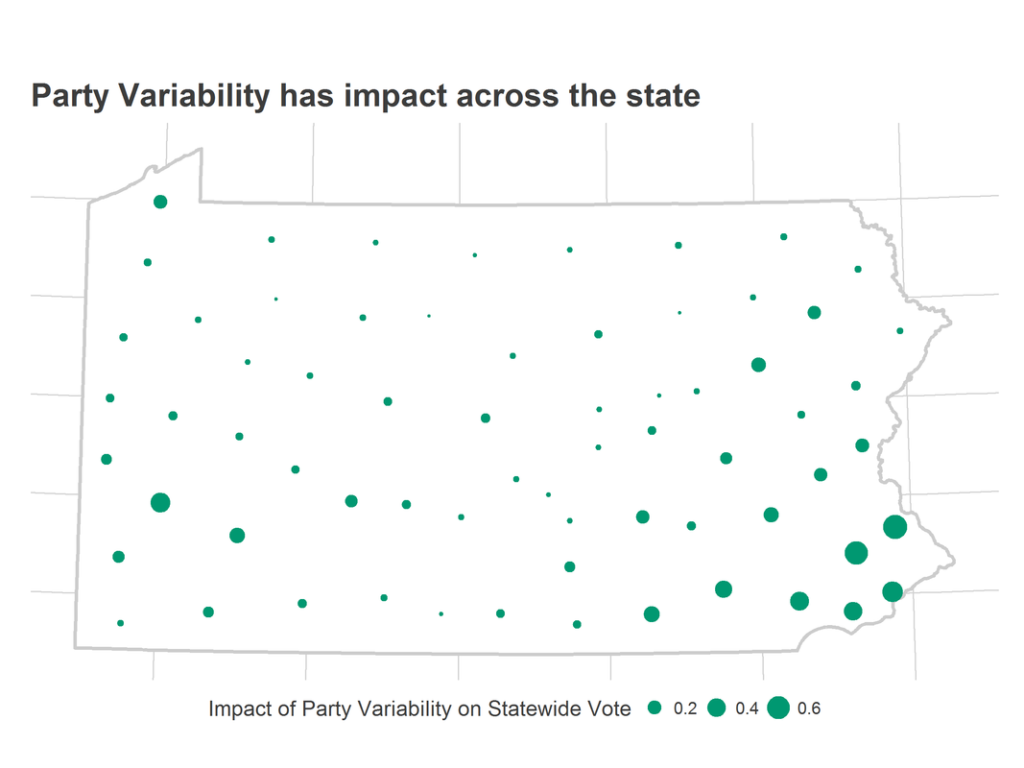
Party Variability impacts the entire state, and the map of the Variability impact largely looks like the map of voters.
Now that 2018 is finally here, there is a lot of analysis to do. In the coming year, I will be profiling local congressional districts, analyzing state and local polls, and trying to understand our city and state a little bit better with each week.
Do you have thoughts for a post? An open question? A calculation or map you’d like to see? Let me know!