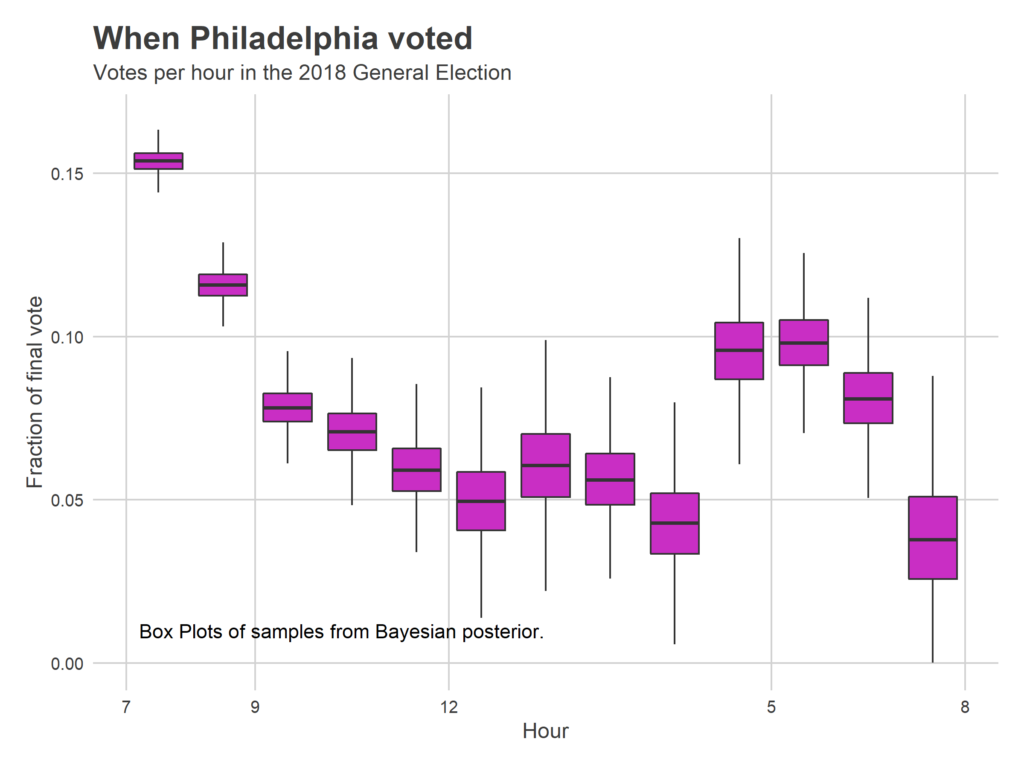
One novel feature of this dataset is that we can look at when through the day Philadelphians voted. I did this back in the Primary, and my surprising finding was that turnout was relatively flat. While there were before- and after-work surges, they weren’t nearly as pronounced as I had expected.
That was a midterm primary. How about this time, in the record-setting general? Two weeks ago we saw an unprecedented, energized electorate, and it looks like their time-of-day voting pattern was different too.
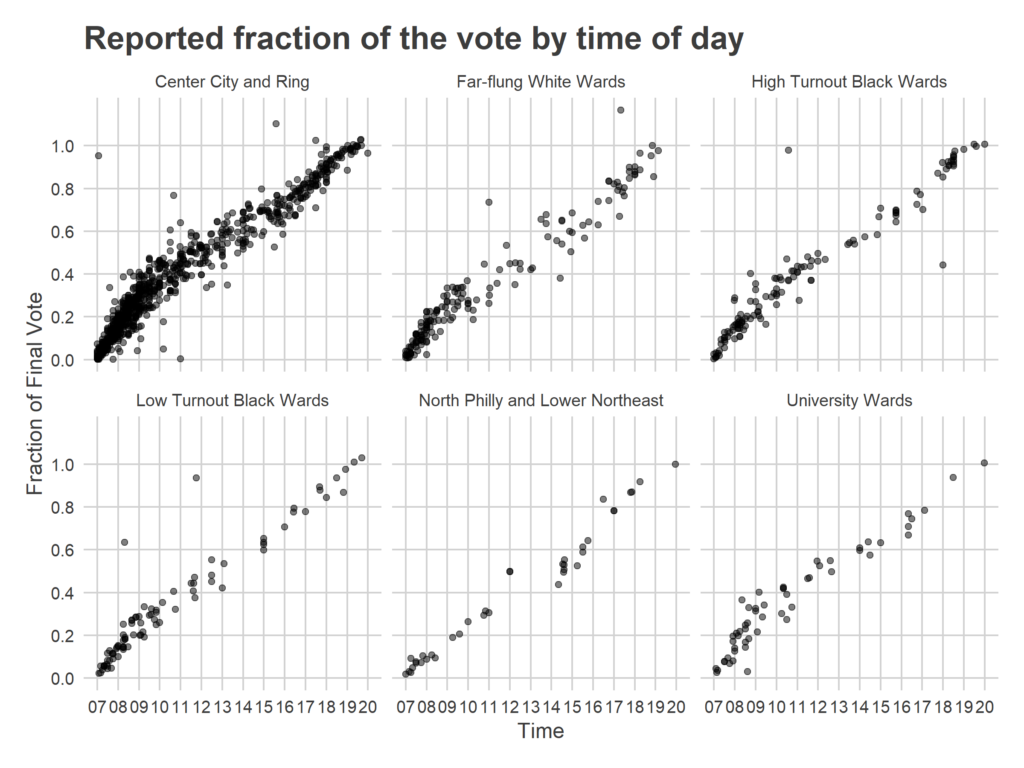
Estimating the overall pattern requires some statistics. Each data submission contains three pieces of information: precinct, time of day, and the cumulative votes at that precinct. Here, I fit something different than my live election-day model, since I have the true final results. I assume that between hours h-1 and h, a fraction f(h) of the city’s population votes, and each precinct as a fraction that randomly deviates from that distribution.
For division d, the fraction of the final votes that have been achieved by hour h is given by
v_d(0) = 0
v_d(h) = v_d(h-1) + f(h) + f_d(h)
where f(h) is the city-wide precinct average fraction (I use an improper, flat prior), and the deviations are drawn from a normal distribution with an unknown standard deviation sigma_dev.
Because observations don’t occur only on the hour, I use linear interpolation in between, so a data submission x_i, which occurs in division d at time h + t with t between 0 and 1, is modeled as
x_i ~ student_t(1, mean = (1-t) v_d(h) + t v_d(h+1), sd = sd_error),
with sd_error unknown.
The result is that I estimate the fraction of the votes cast in a given hour, f(h), around which divisions randomly deviate. Notice that this isn’t exactly the citywide fraction of votes if those deviations from the mean are correlated with overall turnout (if, for example, high-turnout wards also are more likely to vote before 9am), but the coverage of submissions is heavily skewed towards high-turnout wards, so you should read these results as mainly pertaining to high-turnout wards anyway (see below for more). I also don’t account for the fact that needing to add up to 100% of the vote induces correlations in the estimates but… um… this will be fine.
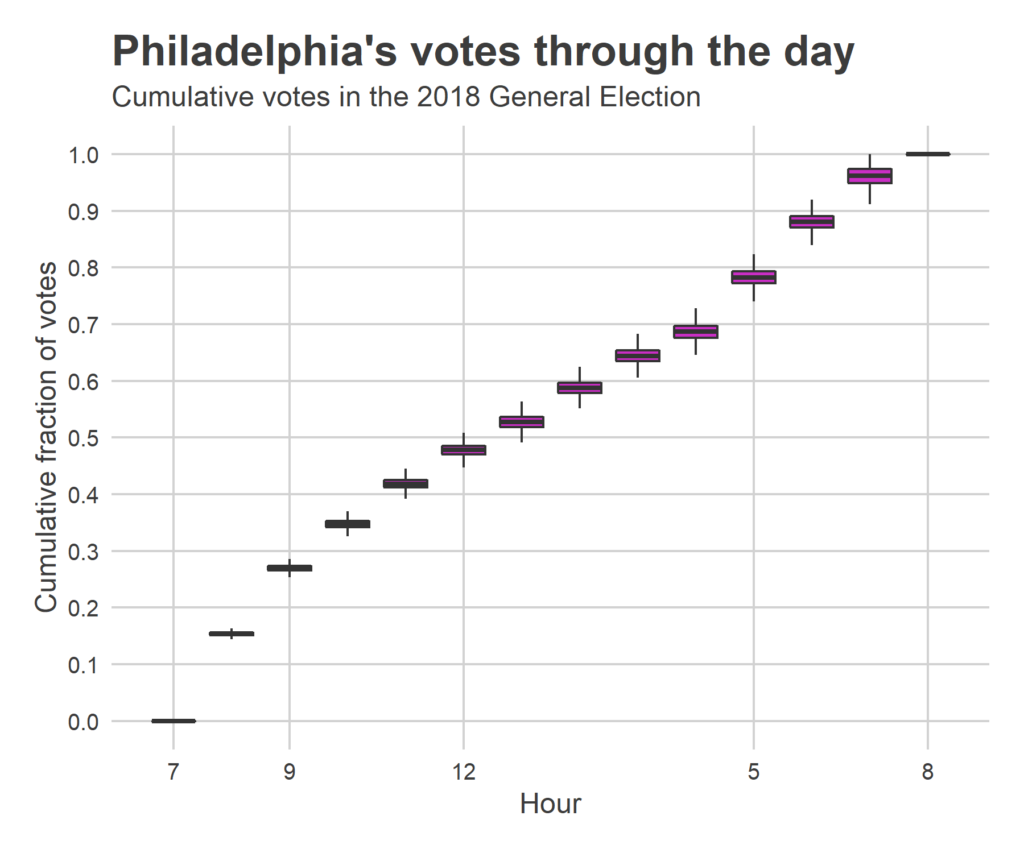
The results: In this election, we saw strong before- and after-work volume, with 26.9% of votes coming before 9am [95% CI: (25.8, 28.1)] and 27.4% of votes coming between 4 and 7pm (24.7 , 30.1).


The overall excitement of the election appears to have largely manifested in the morning, when reports of lines (in a midterm!) came from across the city. There is another surge from 4-7, as people leave work, but once again voting from 7-8 was quiet (without the thunderstorm, this time).
Do neighborhoods vote differently?
It seems likely that residents of different neighborhoods would vote at different times of the day. Unfortunately, the (albeit humbling) participation in the Turnout Tracker came disproportionately from Whiter, wealthier wards, and I don’t have great data to identify differences between groups. But here’s a tentative stab at it.
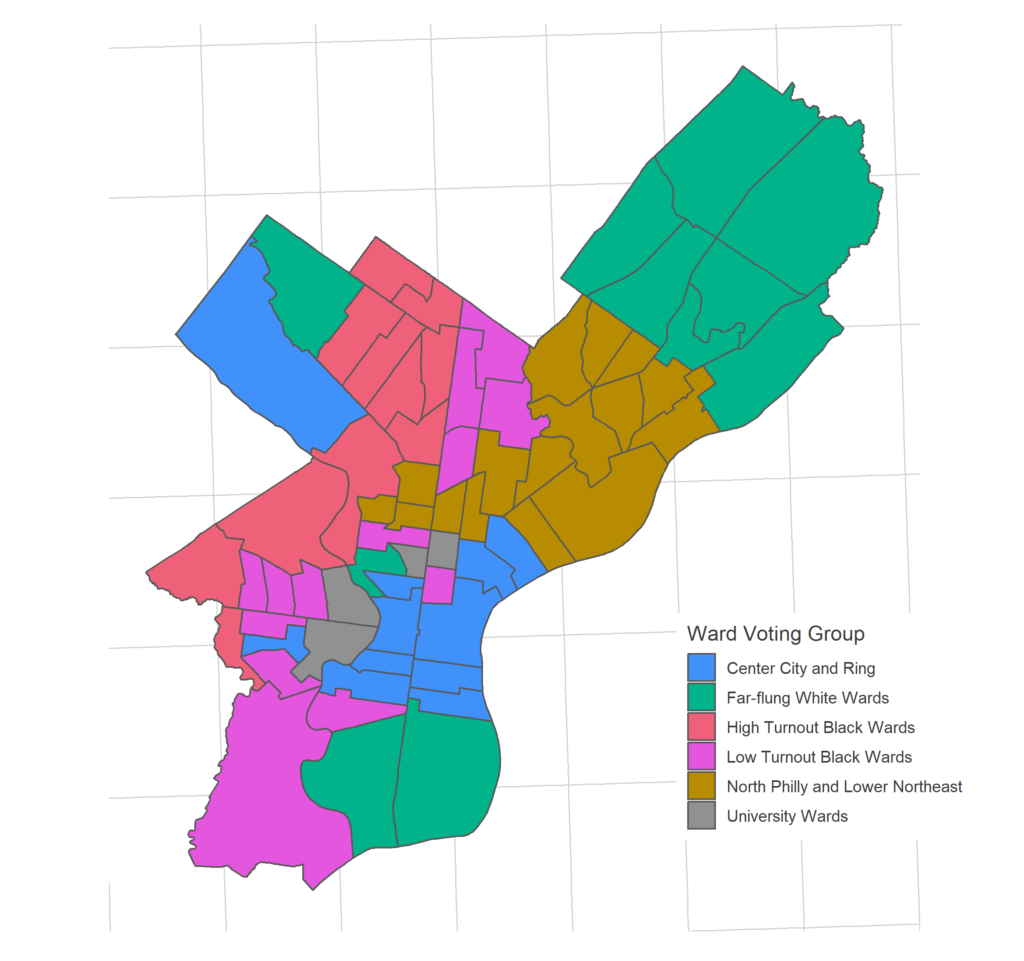
I’ve manually divided wards into six groups based on their overall turnout rates, their correlated voting patterns across the last 16 elections, and racial demographics. (Any categorization is sure to upset people, so I’m preemptively sorry. But these wards appear to vote similarly, and I’ve chosen clear names over euphemistic ones.)


|
Ward Group
|
Percent Voted Before 9am (95% MOE)
|
|
Center City and Ring
|
27.8 +/- 0.7
|
|
Far-Flung White Wards
|
24.0 +/- 1.3
|
|
High-Turnout Black Wards
|
23.7 +/- 1.7
|
|
Low-Turnout Black Wards
|
23.7 +/- 1.5
|
|
North Philly and Lower Northeast
|
16.6 +/- 1.1
|
|
University Wards
|
28.2 +/- 4.7
|
Energy means early voting?
It certainly appears that in this highly energetic election, a disproportionate amount of votes came in the morning. This could mean that the population that gets energized is more likely to vote in the morning (perhaps workers, as opposed to retirees), or that in excited elections, voters want to ensure their vote in the morning.
In May 2019, the Live Election Tracker will be back. And at that point, we’ll have three whole datasets to be able to evaluate time of day data! Then we’ll really be able to say something. Before then, I’ve got a number of posts in the pipeline. Next up: evaluating my various models, some better than others. Stay tuned!