As the Mayor’s race heats up, I’m doing a series establishing some baseline numbers. What follows are simplistic calculations using reasonable assumptions. Welcome to the Back of the Envelope. See Part 1 here.
Will candidates split the vote?
In Part 1, I argued that Philadelphia’s votes will probably be constituted by 35% from the Black Voter wards, 30% from Wealthy Progressive wards, 25% from White Moderate wards, and 10% from Hispanic Voter wards.
This means no single bloc can win the election on its own, and the winner will need to dominate at least one bloc, and do well enough in the others.
The question on my mind is whether candidates could run for the same bloc, and split the vote. With 10 candidates announced, 20% of the vote could be enough to win. If three candidates each try to consolidate the Black Voter divisions, or the Progressive divisions, could a single candidate optimize for the White Moderate divisions and win? And what neighborhoods will candidates presumably do best in?
Below, I consider candidates’ past elections to guess which blocs they’ll be targetting.
View code
library(tidyverse)
library(sf)

source("../../admin_scripts/util.R")


setwd("C:/Users/Jonathan Tannen/Dropbox/sixty_six/posts/council_ballot_position_23/")

df_major_type <- readRDS("../../data/processed_data/df_major_type_20230116.Rds")
df_major <- df_major_type %>%
  group_by(office, candidate, party, warddiv, year, election_type, district, ward, is_topline_office) %>%
  summarise(votes = sum(votes))

df_major <- df_major %>%
  group_by(year, election_type, office, district, warddiv) %>%
  mutate(pvote = votes / sum(votes)) %>%
  ungroup()

topline_votes <- df_major %>%
  filter(is_topline_office) %>%
  group_by(election_type, year) %>%
  summarise(votes = sum(votes)) %>%
  mutate(
    year = asnum(year),
    cycle = case_when(
      year %% 4 == 0 ~ "President",
      year %% 4 == 1 ~ "District Attorney",
      year %% 4 == 2 ~ "Governor",
      year %% 4 == 3 ~ "Mayor"
    )
  )

cycle_colors <- c("President" = strong_red, "Mayor" = strong_blue, "District Attorney" = strong_green, "Governor" = strong_orange)

office_votes = df_major %>%
  group_by(
    year, warddiv, election_type, office, district
  ) %>%
  summarise(total_votes = sum(votes))

format_name <- function(x){
  x <- stringr::str_to_lower(x)
  x <- gsub("(^|\\s)([a-z])", "\\1\\U\\2", x, perl = TRUE)
  x
}
divs <- st_read("../../data/gis/warddivs/202011/Political_Divisions.shp") %>%
mutate(warddiv = pretty_div(DIVISION_N))source("../../data/prep_data/div_svd_time_util.R")
div_cat_fn <- readRDS("../../data/processed_data/svd_time_20230116.RDS")
div_cats <- div_cat_fn %>% get_row_cats(2017) %>% rename(warddiv = row_id)
cats <- c(
"Black Voters",
"Wealthy Progressives",
"Hispanic Voters",
"White Moderates"
)
cat_colors <- c(light_blue, light_red, light_orange, light_green)
names(cat_colors) <- catsWhat blocs will each candidate target?
For each candidate, let’s look at some relevant elections. First, the At Large Council candidates, for whom we have the best, city-wide, reference elections.
View code
relevant_elections <- tribble(
  ~candidate, ~year, ~election_type, ~office,
  "ALLAN DOMB", 2015, "primary", "COUNCIL AT LARGE",
  "ALLAN DOMB", 2019, "primary", "COUNCIL AT LARGE",
  "DEREK S GREEN", 2015, "primary", "COUNCIL AT LARGE",
  "DEREK S GREEN", 2019, "primary", "COUNCIL AT LARGE",
  "HELEN GYM", 2015, "primary", "COUNCIL AT LARGE",
  "HELEN GYM", 2019, "primary", "COUNCIL AT LARGE",
  "REBECCA RHYNHART", 2017, "primary", "CITY CONTROLLER",
  # "REBECCA RHYNHART", 2021, "primary", "CITY CONTROLLER",
) %>% mutate(year = as.character(year))

comp_results <- df_major %>%
  inner_join(relevant_elections) %>%
  left_join(office_votes) %>%
  group_by(candidate, year, election_type, office) %>%
  mutate(
    pvote_total = sum(votes, na.rm=TRUE) / sum(total_votes, na.rm=TRUE)
  ) %>%
  ungroup()

cat_results <- comp_results %>%
  left_join(div_cats %>% select(-year)) %>%
  group_by(year, cat, candidate, election_type, office) %>%
  summarise(pvote = sum(votes) / sum(total_votes))


ggplot(
  divs %>%
    left_join(comp_results) %>%
    filter(office == "COUNCIL AT LARGE")
) +
  geom_sf(aes(fill=100 * pmin(pvote, 0.20)), color=NA) +
  facet_grid(format_name(candidate) ~ year) +
  scale_fill_viridis_c("% of Votes") +
  theme_map_sixtysix() %+replace%
  theme(legend.position = "right") +
  labs(
    title="City Council At Large Results"
  )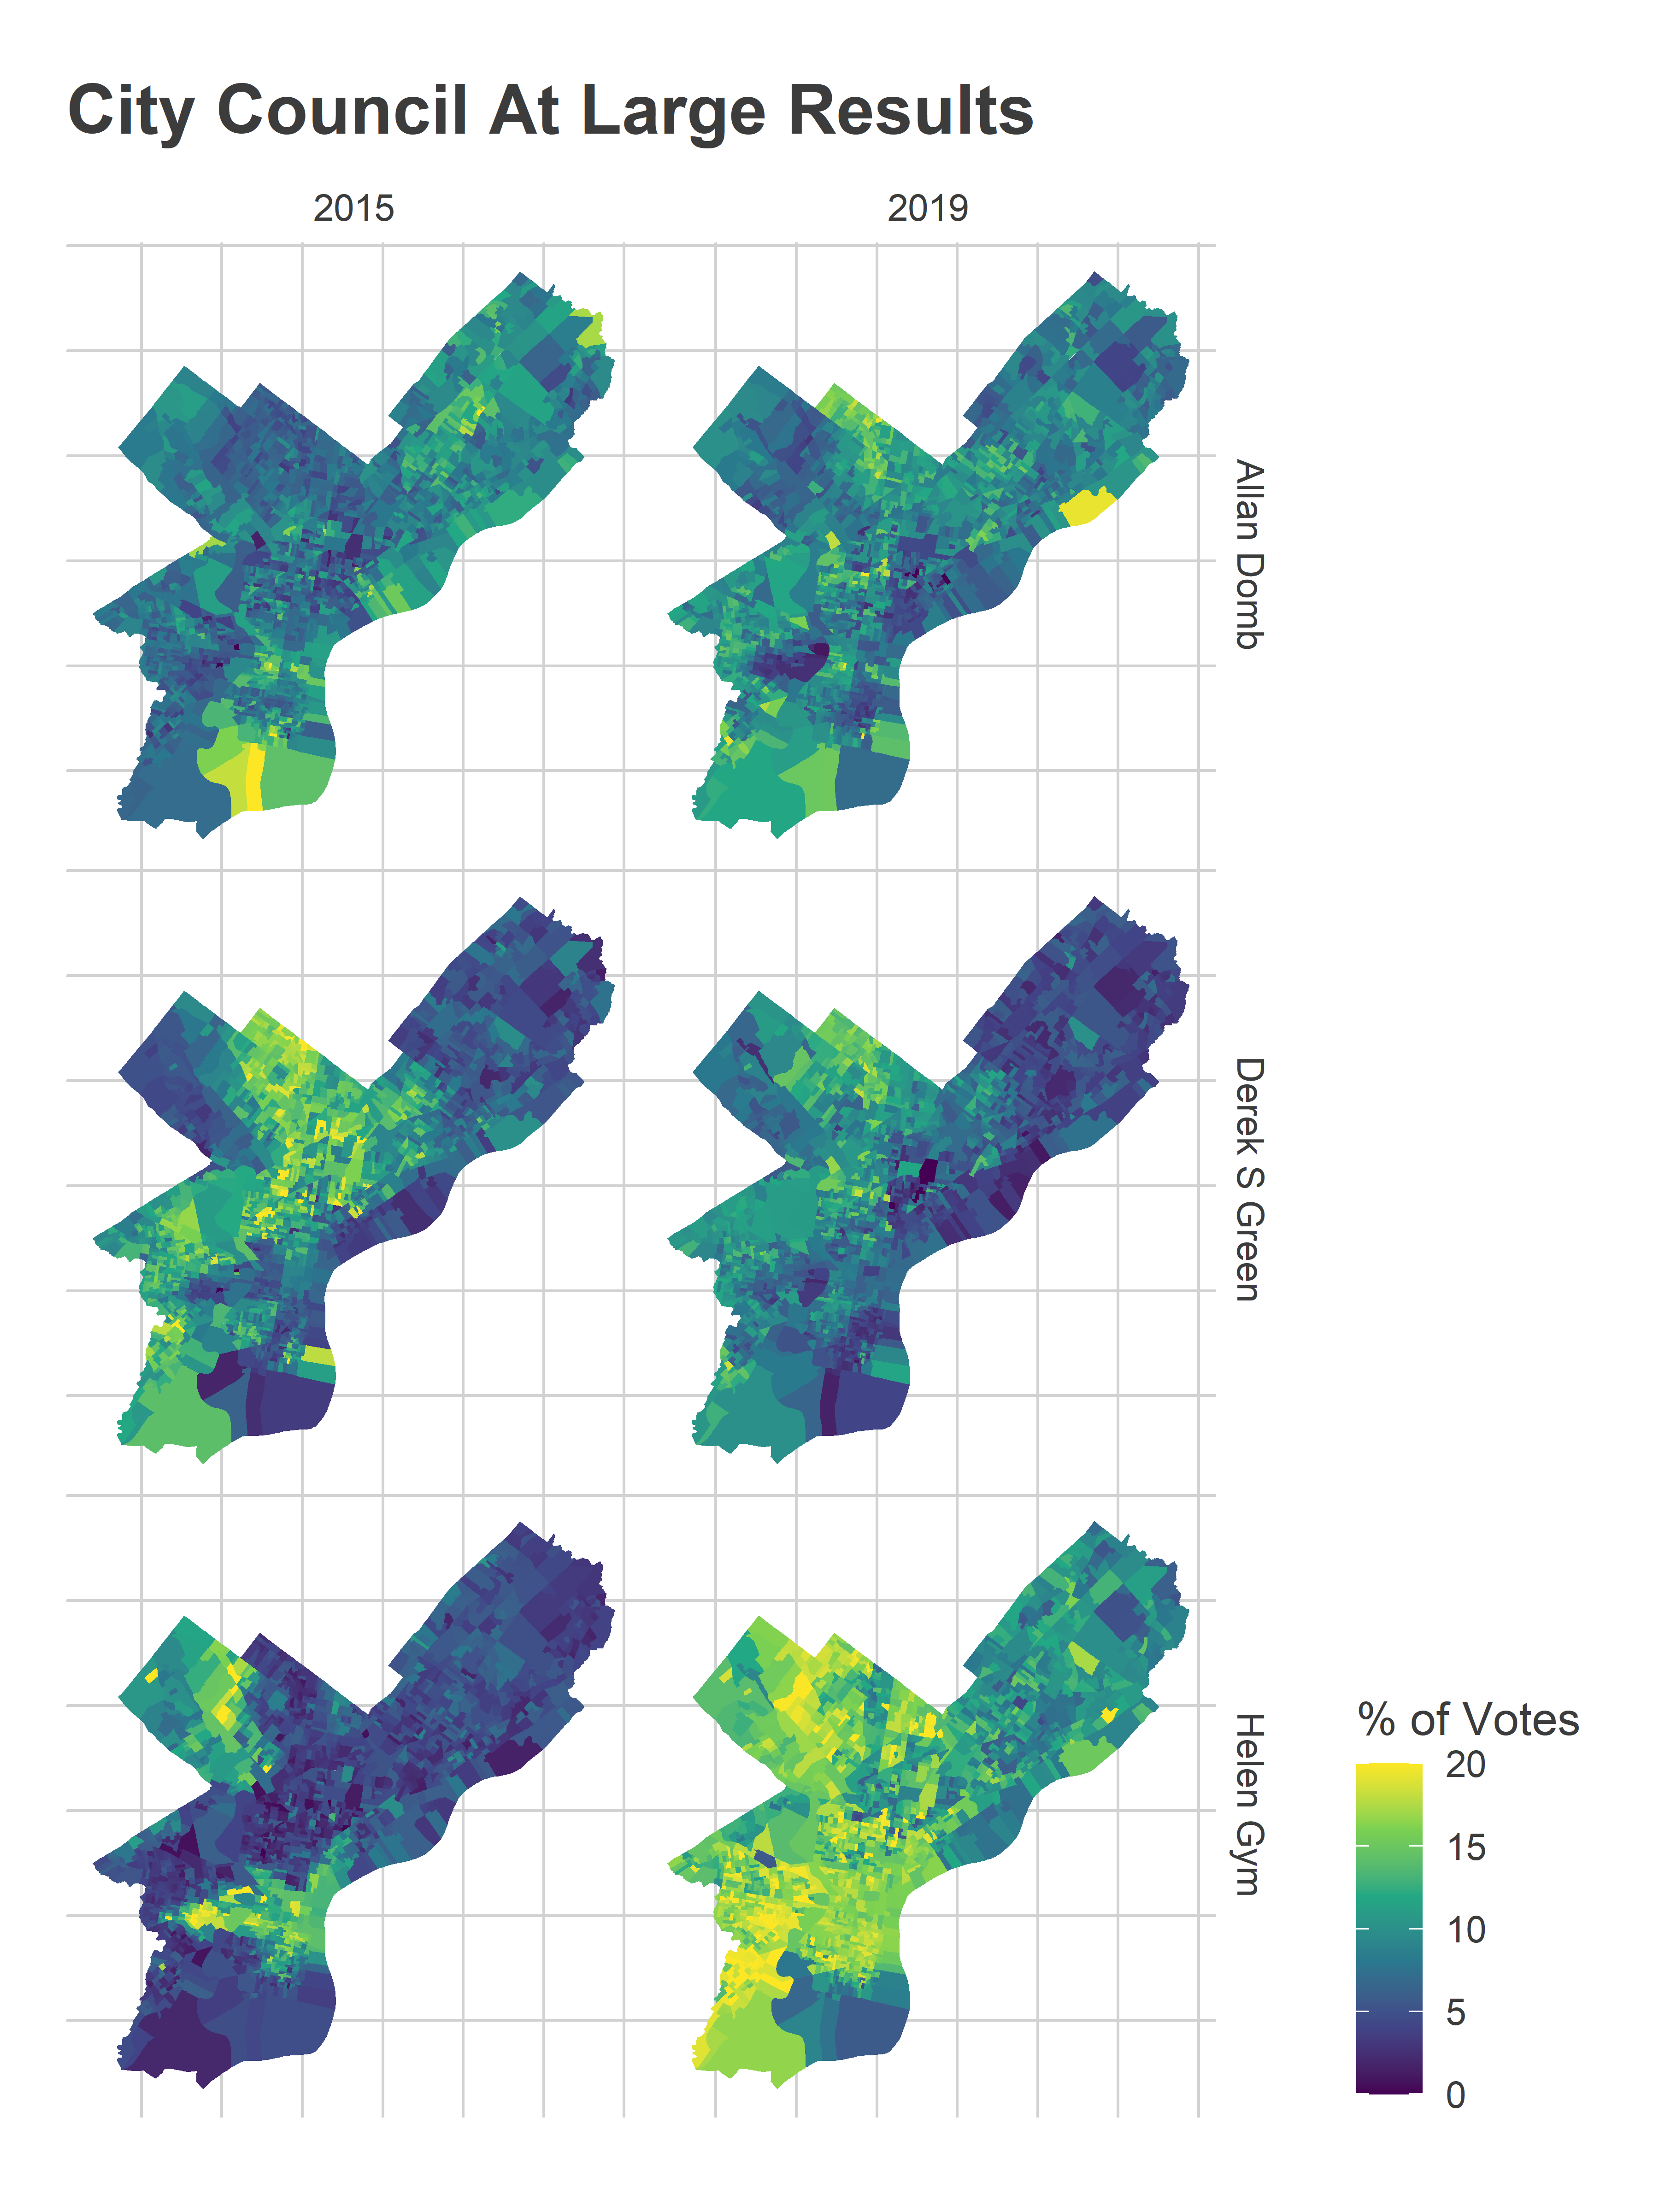
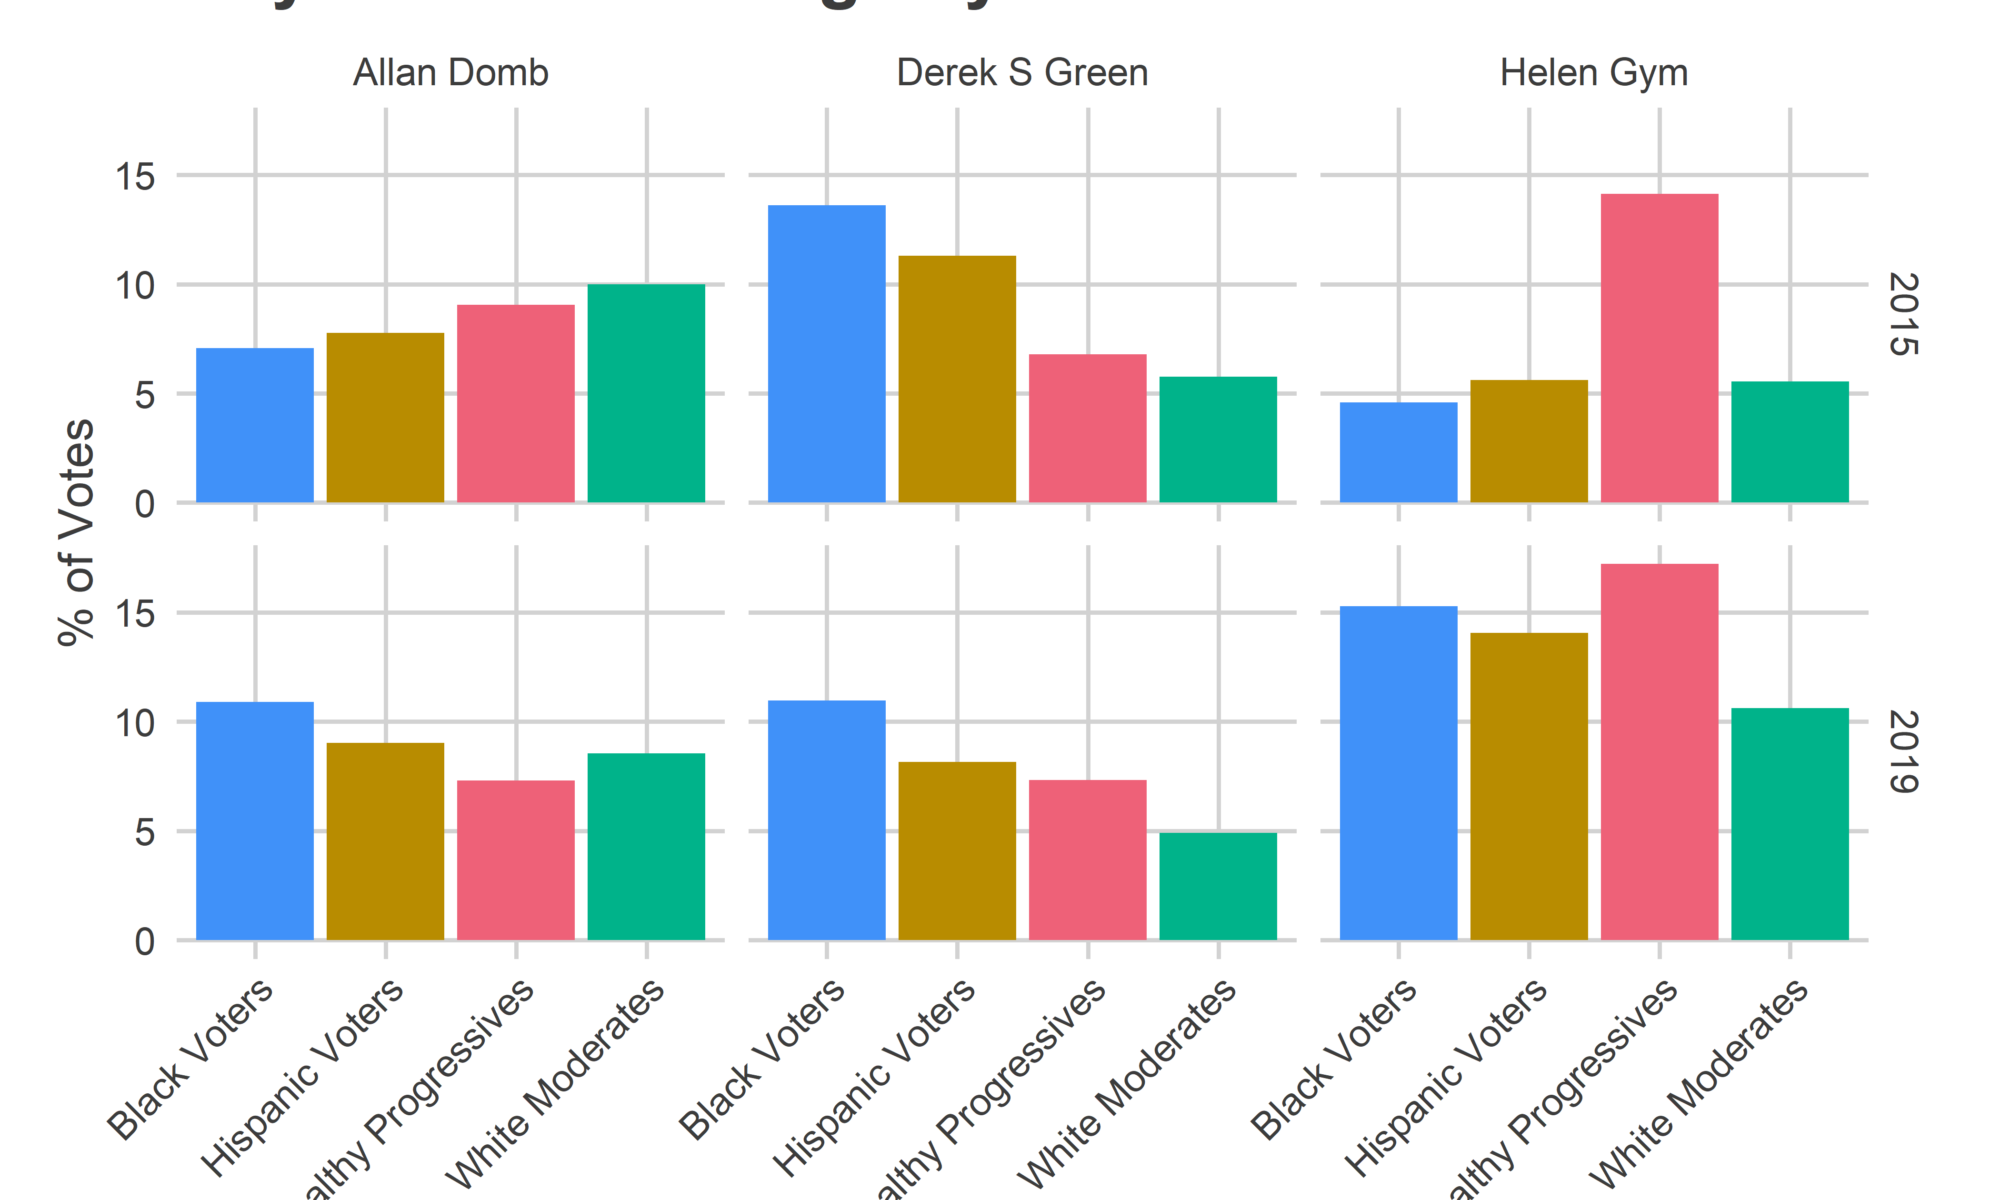
In 2015, Domb did best in the River Wards, the Northeast, South Philly, and immediate Center City. Derek Green did best among Black divisions in West, and North Philly. Helen Gym did best in the ring around Center City and Chestnut Hill / Mount Airy.
In 2019, we see the effects of incumbency. Gym led the pack by dominating the Wealthy Progressive and Black Wards from the first column, Green did well enough everywhere despite losing his top ballot position, and Domb improved across Black Wards thanks to incumbency and the party endorsement.
View code
ggplot(
  cat_results %>% filter(office == "COUNCIL AT LARGE"),
  aes(x=cat, y=100*pvote)
) +
  geom_bar(aes(fill=cat), color=NA, stat="identity") +
  facet_grid(year ~ format_name(candidate)) +
  scale_fill_manual(values=cat_colors, guide=FALSE) +
  theme_sixtysix() %+replace%
  theme(axis.text.x = element_text(angle=45, hjust = 1, vjust=1)) +
  labs(
    title="City Council At Large by Bloc",
    x=NULL,
    y = "% of Votes"
  )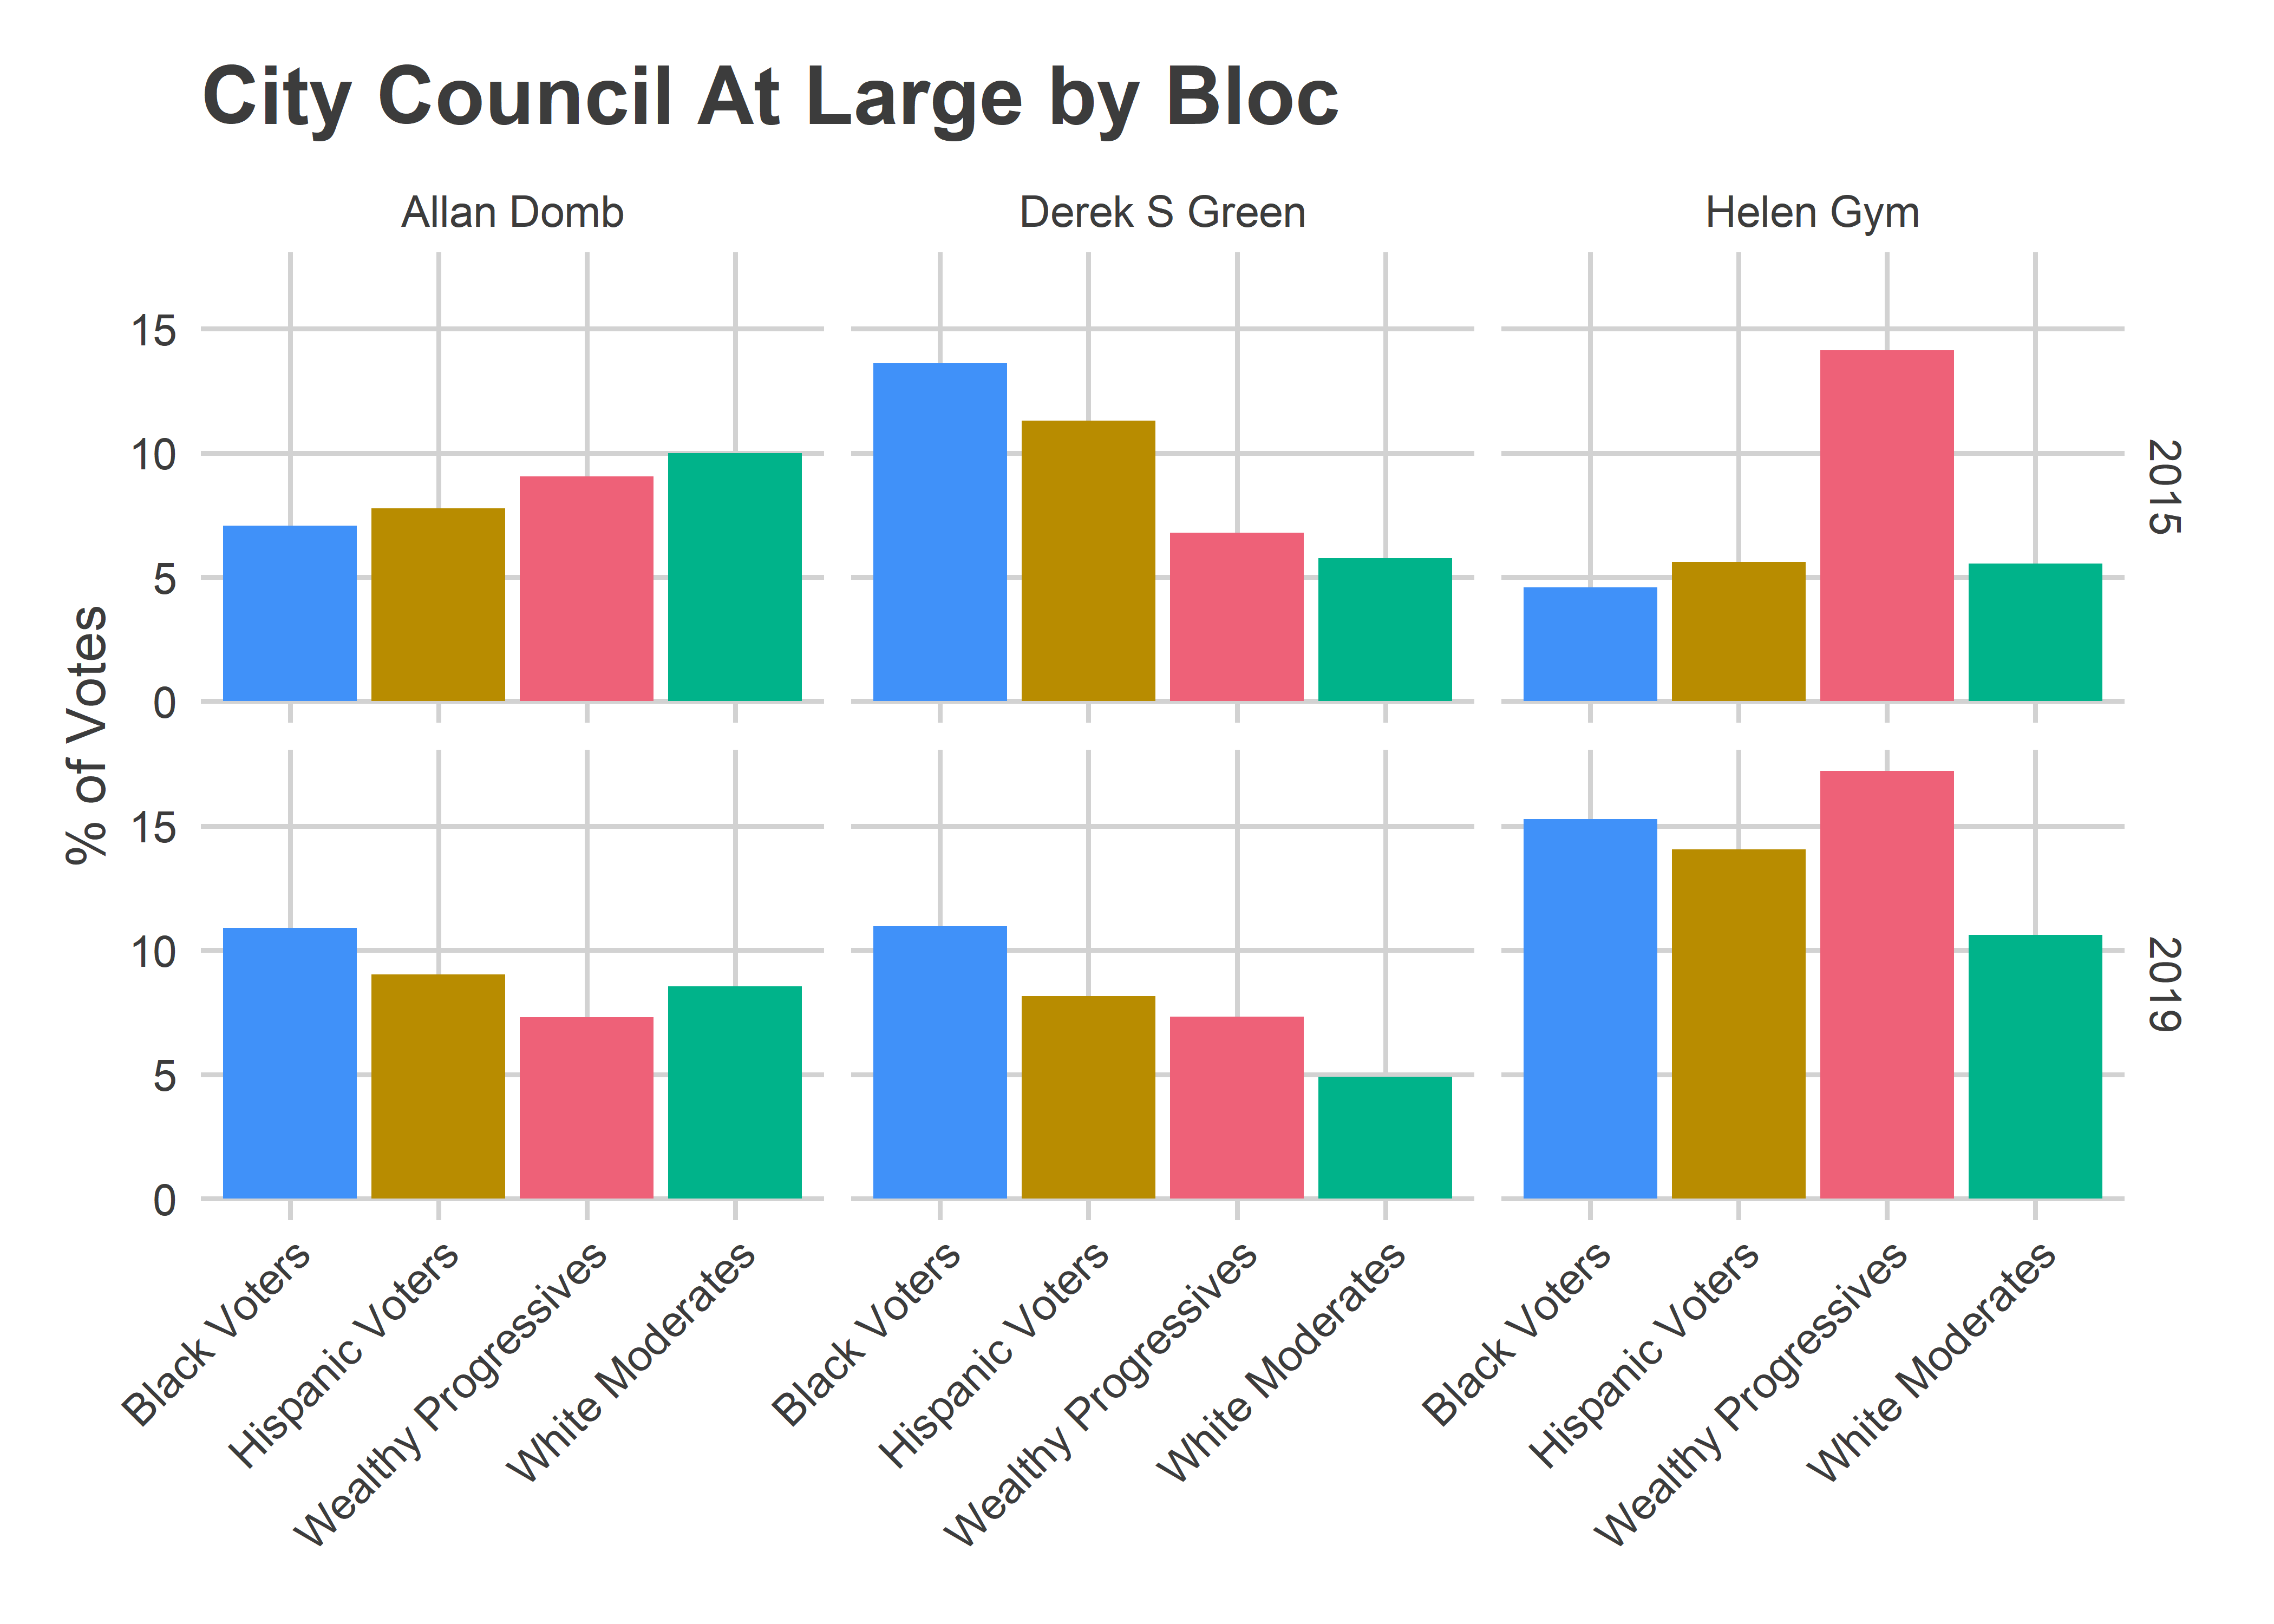
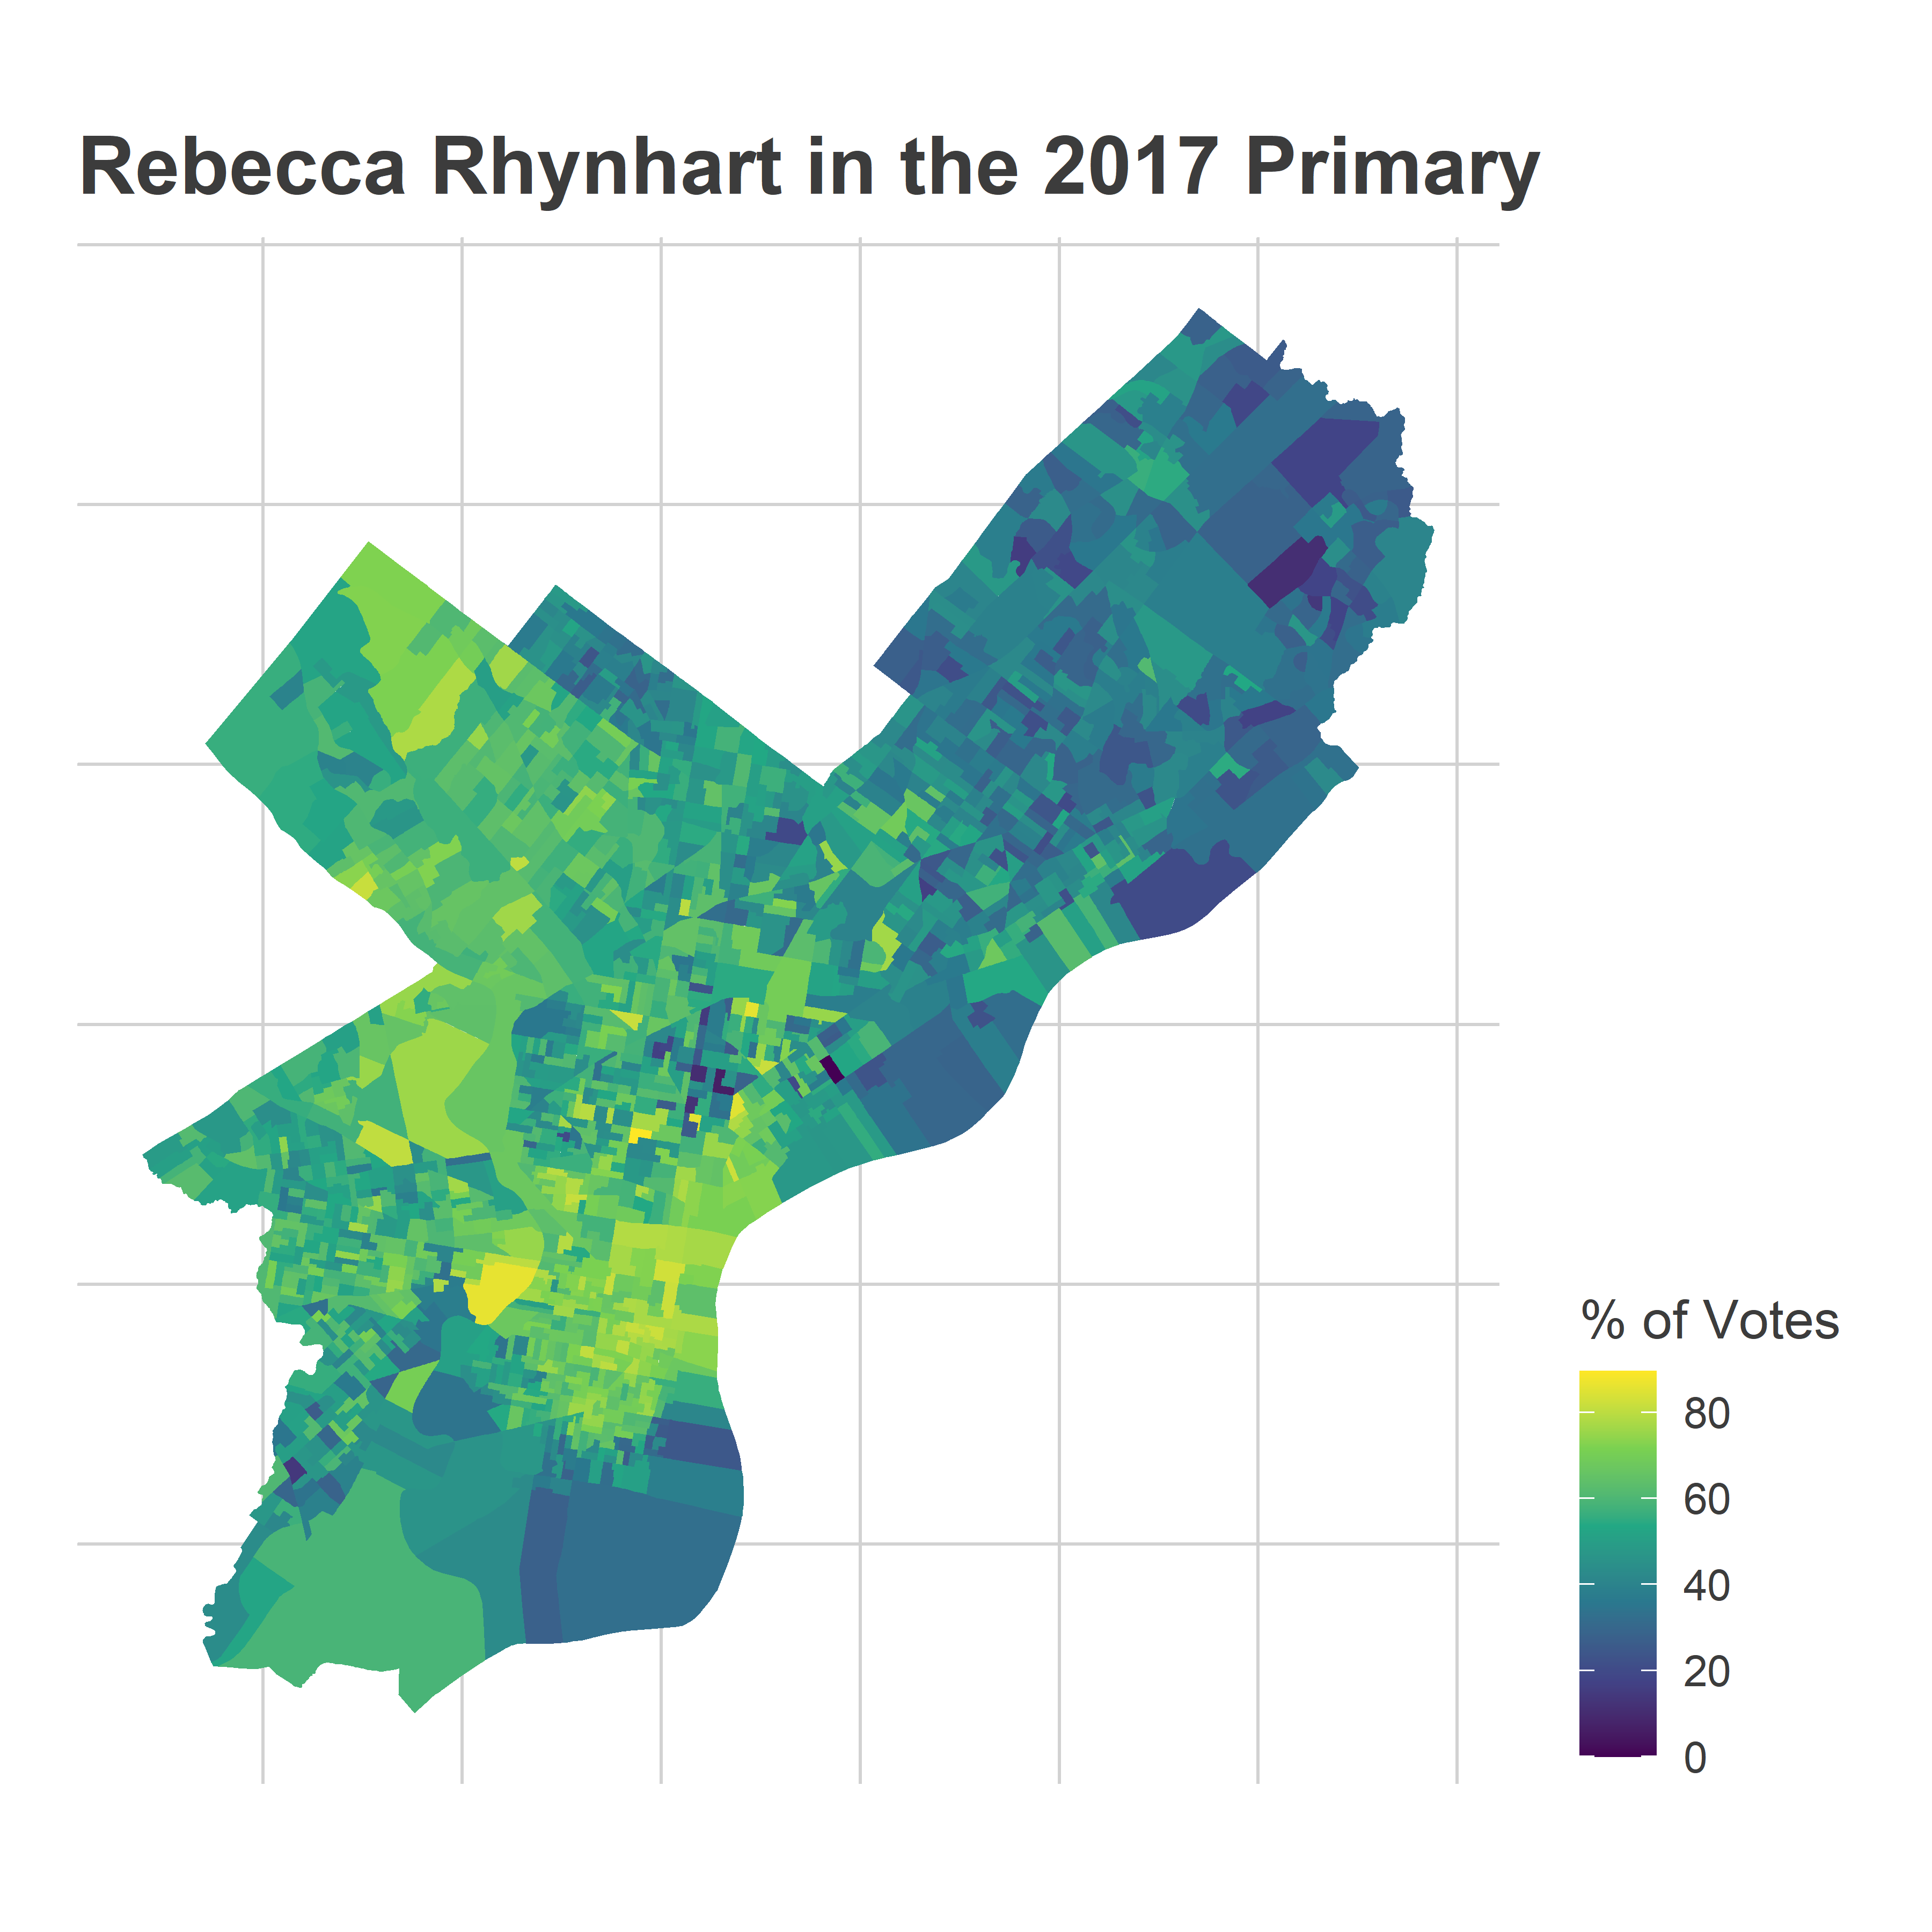
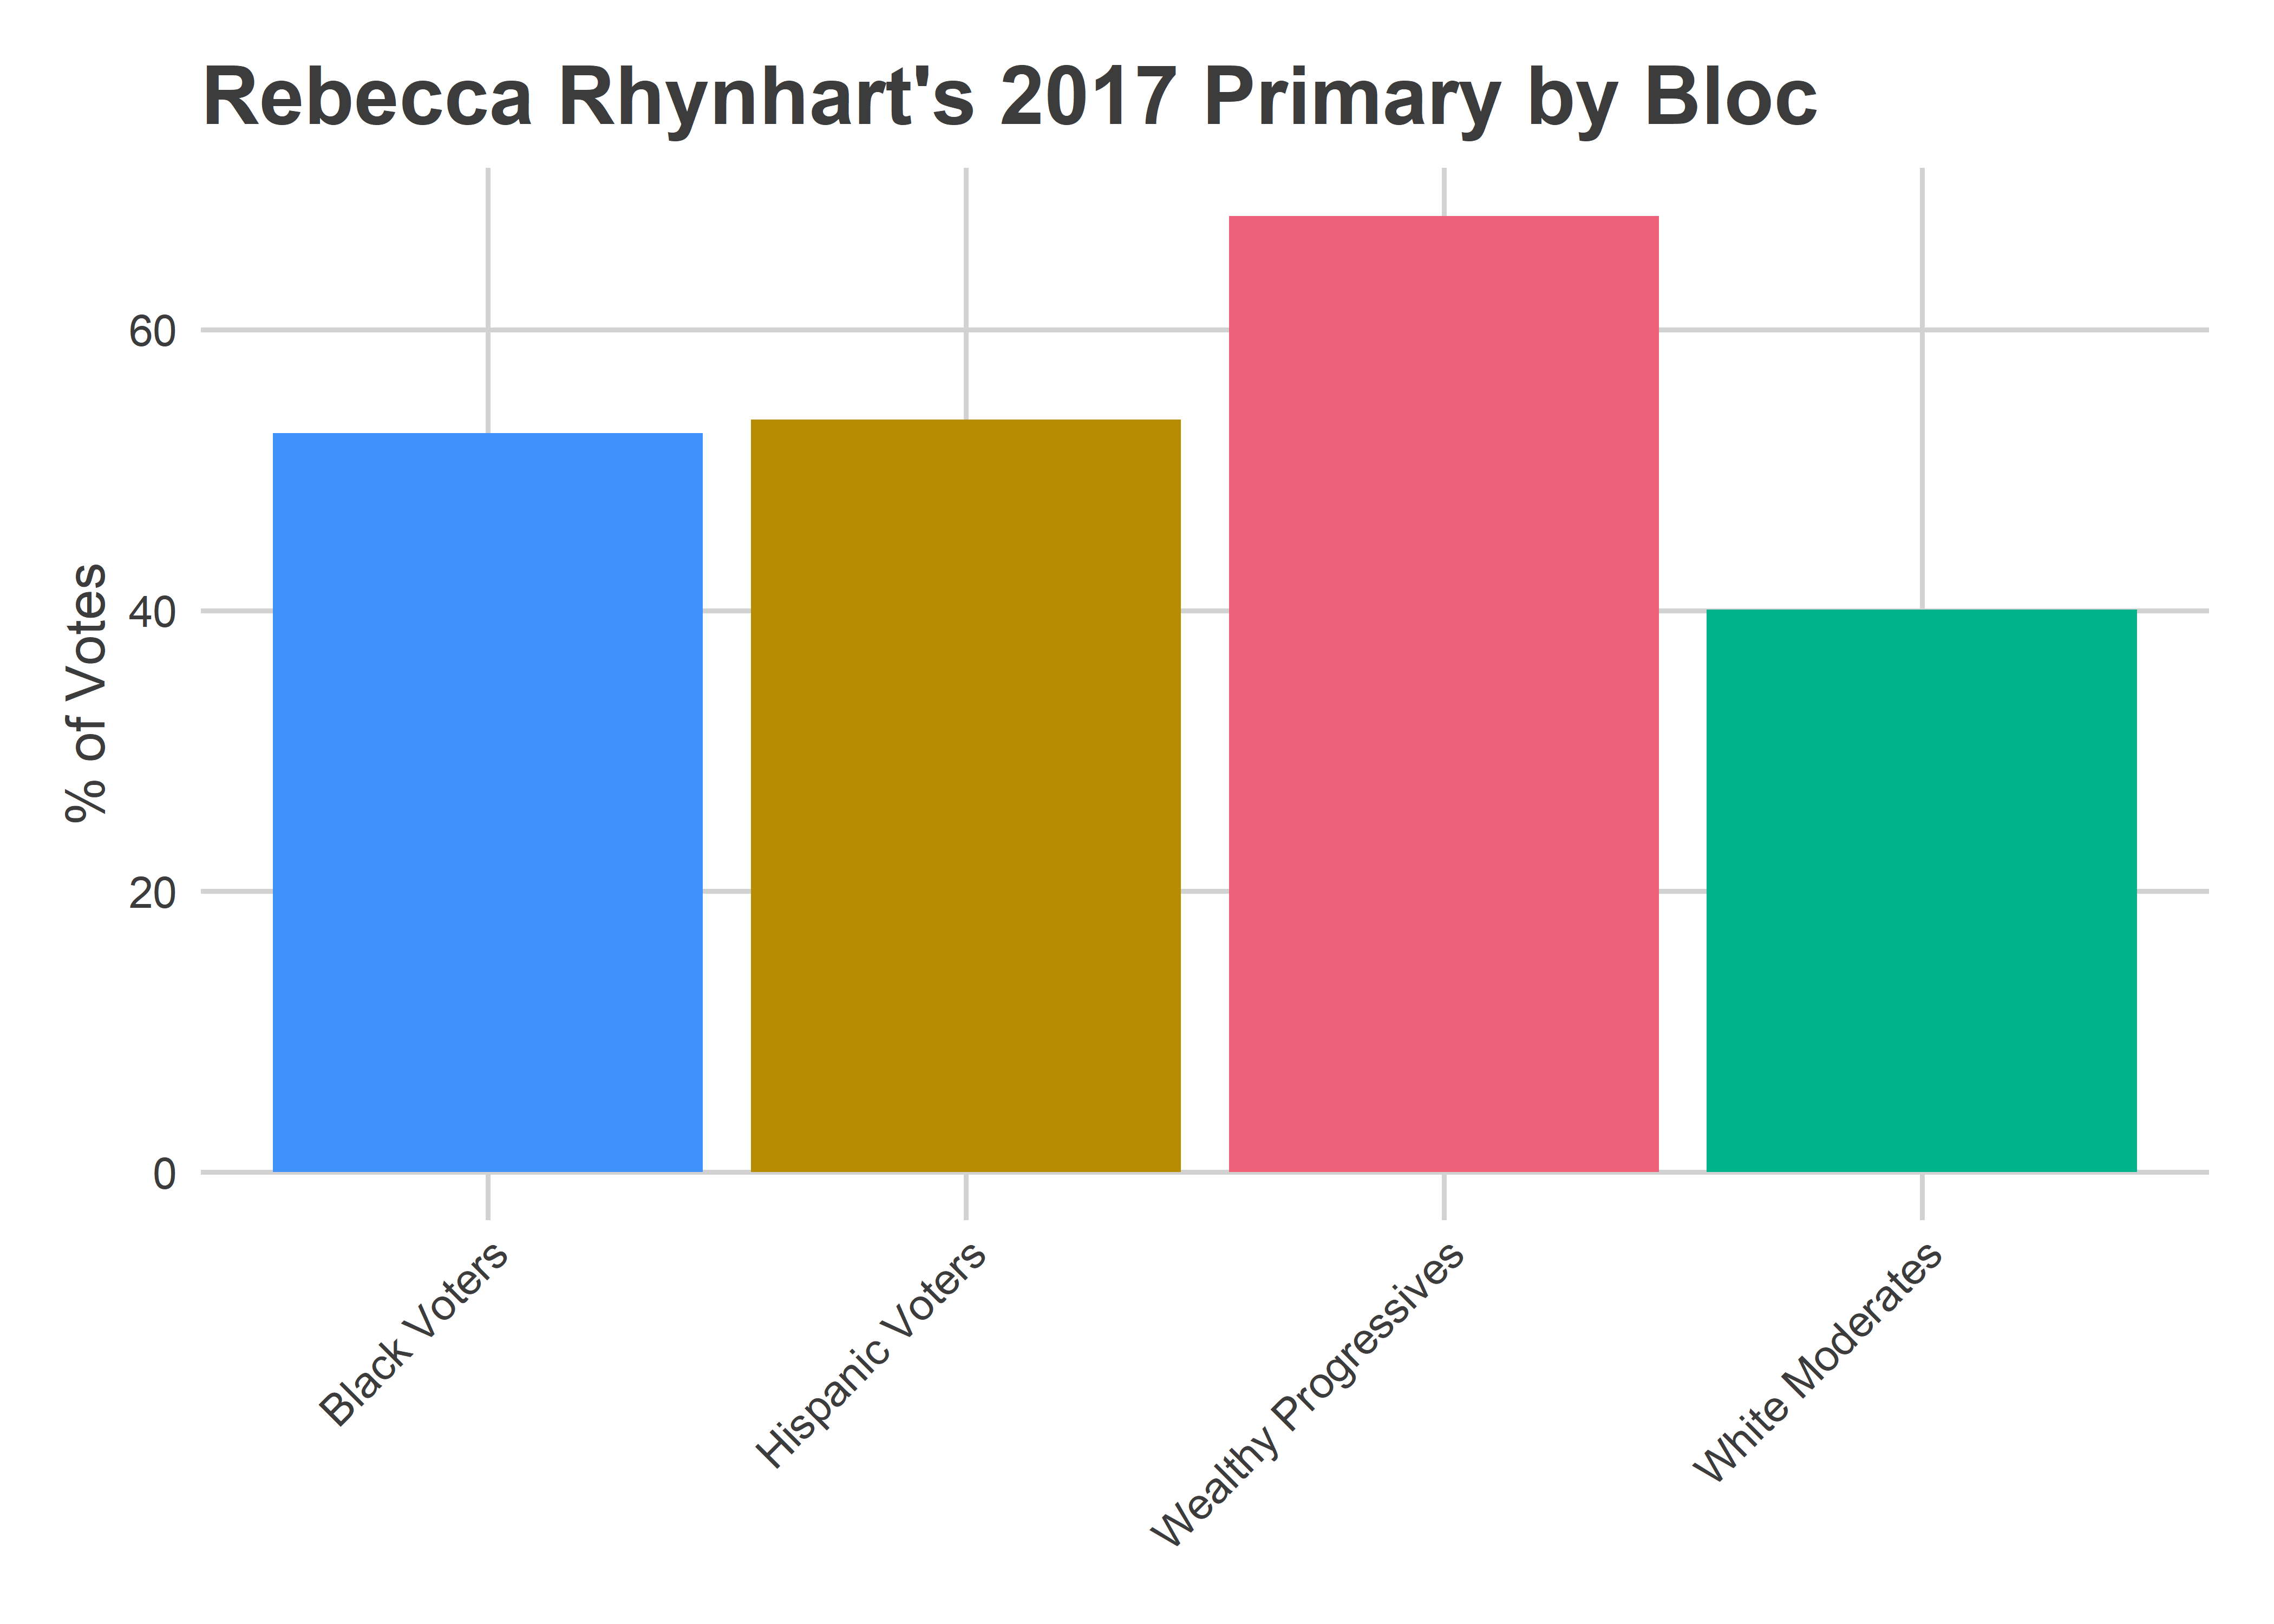
Rhynhart won a competitive primary in 2017, albeit in the lower profile City Controller race. She did so by cleaning up in the Wealthy Progressive wards around Center City, though did beat 50% in the Black and Hispanic Voter blocs.
View code
ggplot(
  divs %>%
    left_join(comp_results) %>%
    filter(office == "CITY CONTROLLER")
) +
  geom_sf(aes(fill=100 * pvote), color=NA) +
  # facet_grid(format_name(candidate) ~ year) +
  scale_fill_viridis_c("% of Votes") +
  theme_map_sixtysix() %+replace%
  theme(legend.position = "right") +
  labs(
    title="Rebecca Rhynhart in the 2017 Primary"
  )
View code
ggplot(
  cat_results %>% filter(office == "CITY CONTROLLER"),
  aes(x=cat, y=100*pvote)
) +
  geom_bar(aes(fill=cat), color=NA, stat="identity") +
  # facet_grid(year ~ format_name(candidate)) +
  scale_fill_manual(values=cat_colors, guide=FALSE) +
  theme_sixtysix() %+replace%
  theme(axis.text.x = element_text(angle=45, hjust = 1, vjust=1)) +
  labs(
    title="Rebecca Rhynhart's 2017 Primary by Bloc",
    x=NULL,
    y = "% of Votes"
  )
Three candidates come from districted seats: Cherelle Parker, Maria Quiñones-Sánchez, and Amen Brown. We don’t have city-wide elections for them, but can reasonably guess that they’ll do well in the blocs that their districts constitute.
View code
district_elections <- tribble(
  ~candidate, ~year, ~election_type, ~office,
  "CHERELLE L PARKER", 2019, "primary", "DISTRICT COUNCIL",
  "MARIA QUIÑONES SÁNCHEZ", 2019, "primary", "DISTRICT COUNCIL",
  "AMEN BROWN", 2022, "primary", "REPRESENTATIVE IN THE GENERAL ASSEMBLY"
) %>% mutate(year = as.character(year))

districts <-
  divs %>% inner_join(
    df_major %>%
    inner_join(district_elections) %>%
    select(office, district, warddiv, candidate)
  ) %>% group_by(office, district, candidate) %>%
  summarise(
    geometry=st_union(geometry)
  )
districts <- nngeo::st_remove_holes(districts)


phila_whole <- st_read("../../data/gis/warddivs/201911/Political_Wards.shp") %>%
  st_union()ggplot(phila_whole) +
  geom_sf(color=NA) +
  geom_sf(data=districts, aes(fill = candidate), color=NA) +
  geom_sf_text(
    data=districts %>% mutate(geom = st_centroid(geom)),
    aes(label = sprintf(
      "%s\n(%s-%s)",
      format_name(candidate),
      case_when(office == "DISTRICT COUNCIL" ~ "Council", TRUE ~ "PA"),
      district
    )),
    fontface="bold"
  ) +
  scale_fill_discrete(guide=F) +
  theme_map_sixtysix() +
  labs(
    title="Mayoral Candidates' Districts"
  )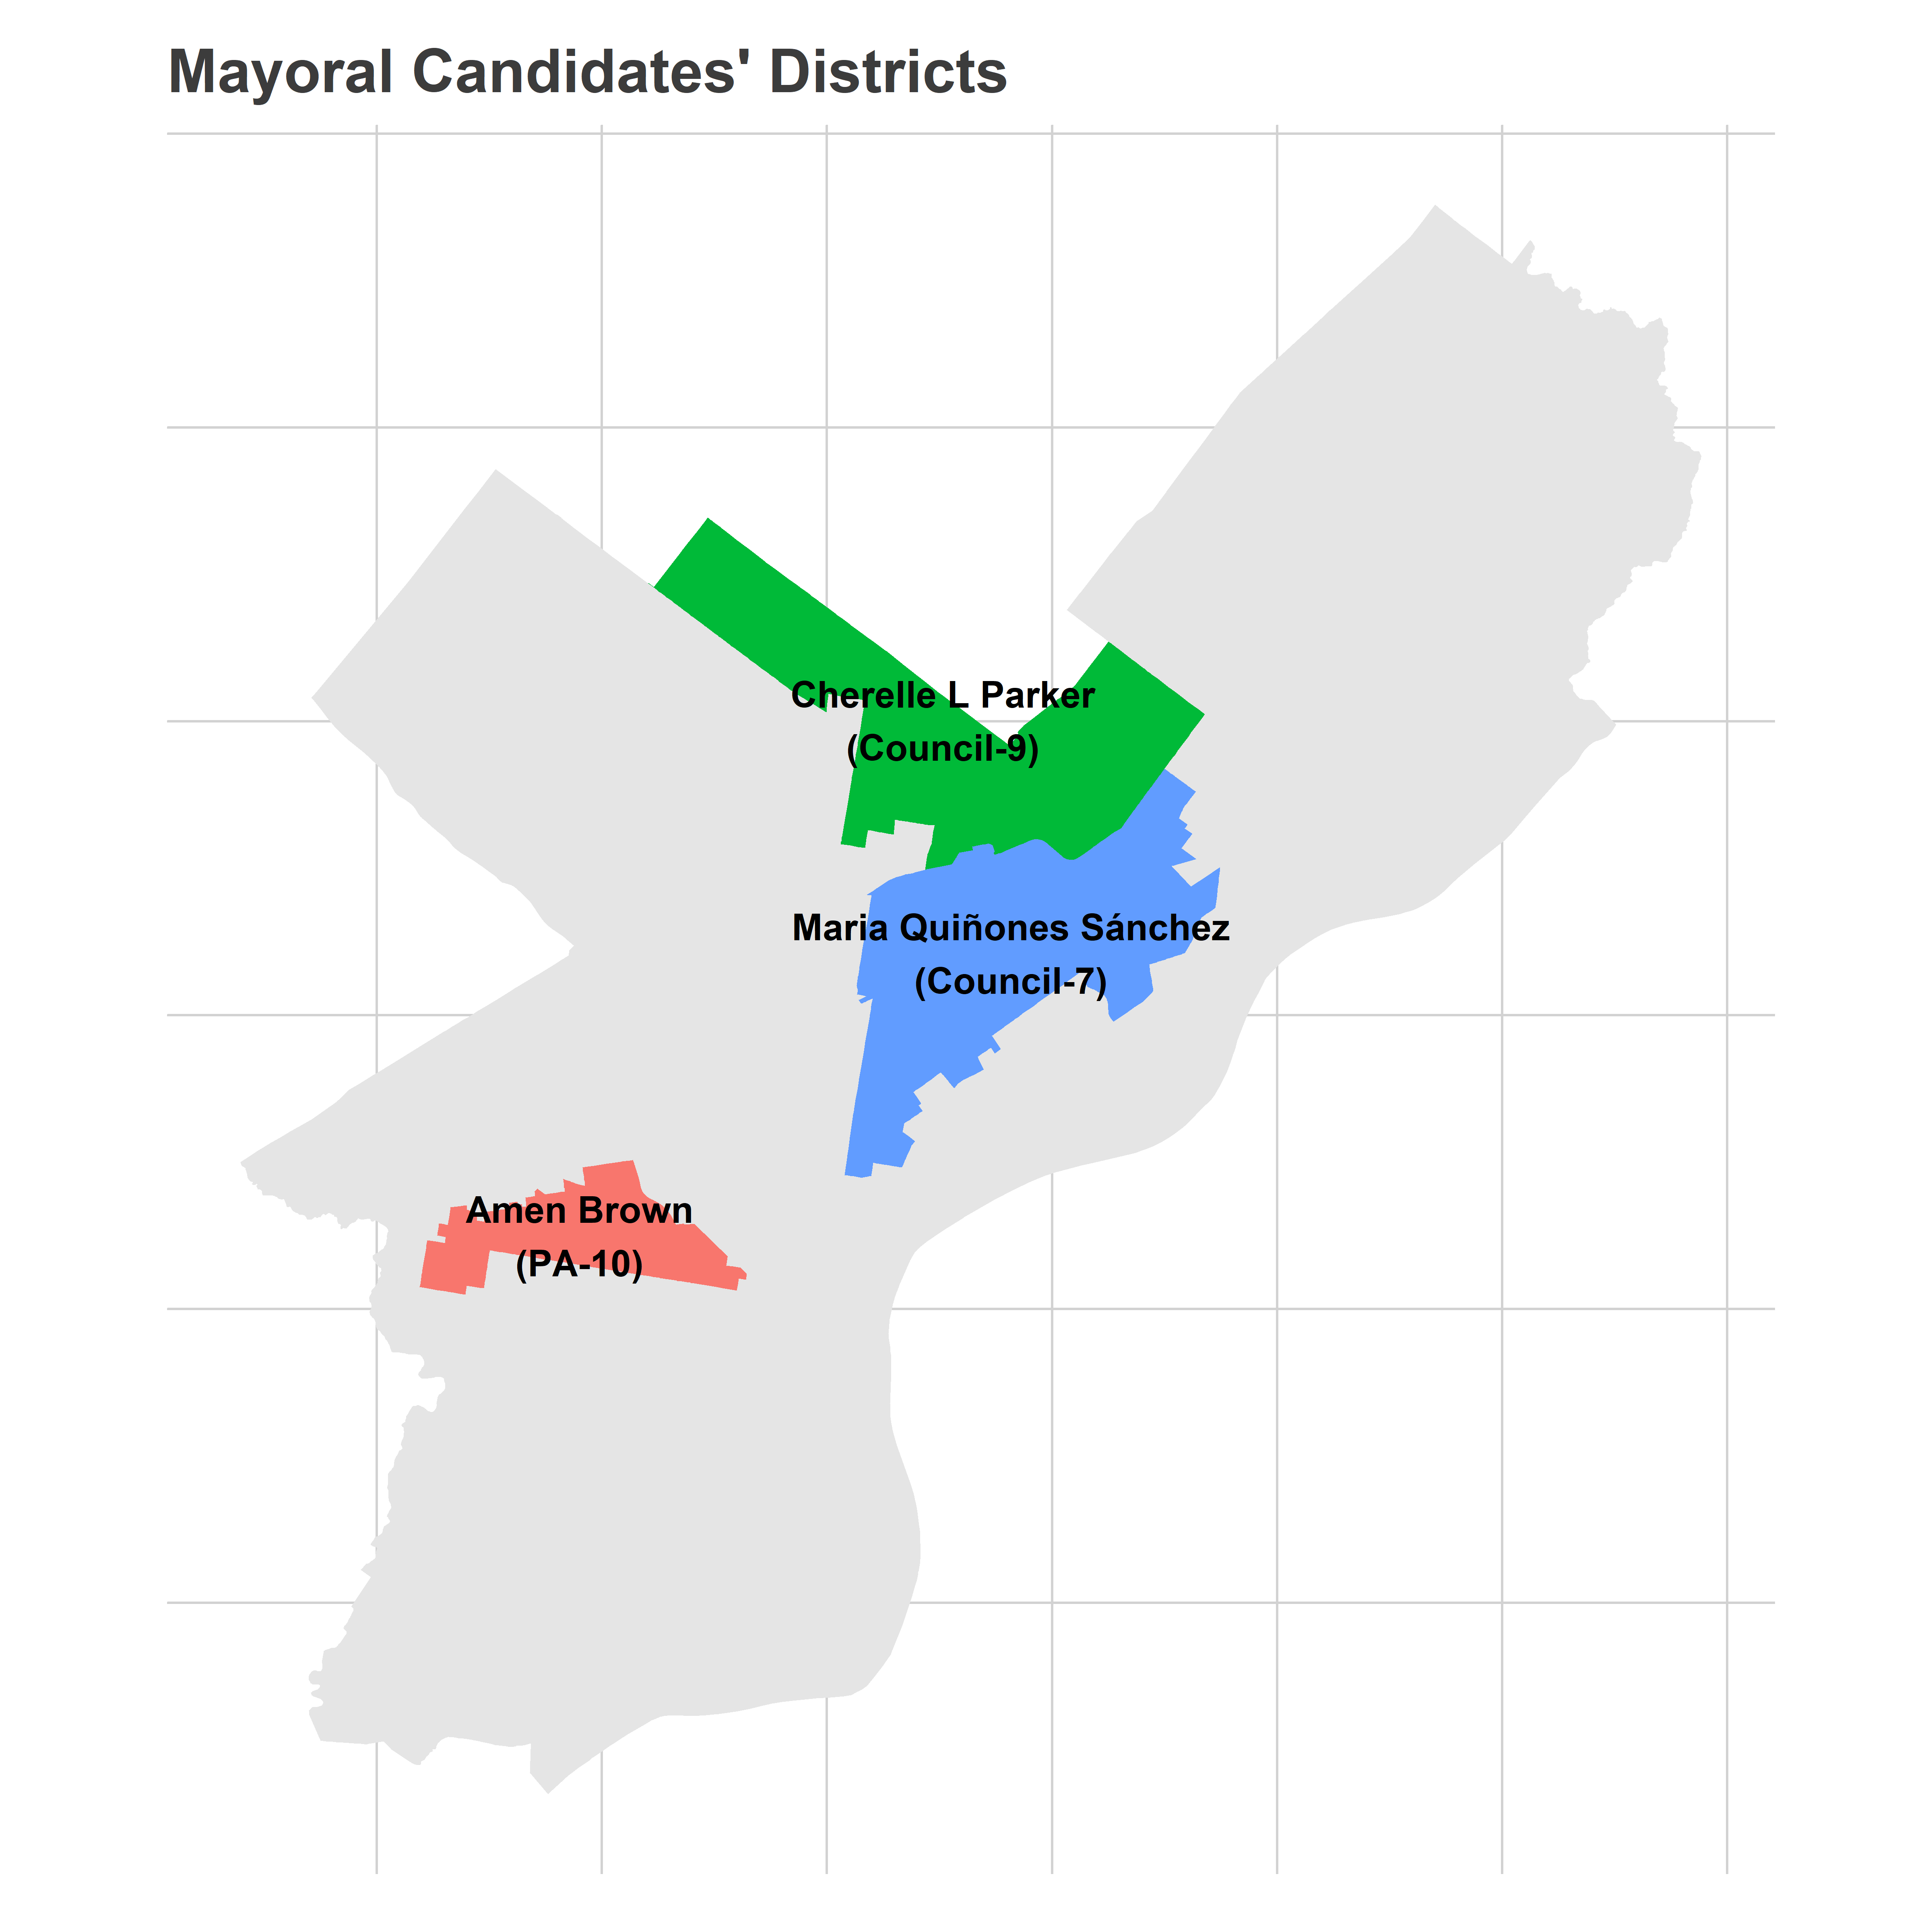
Parker and Brown represent predominantly-Black districts, Quiñones-Sánchez a predominantly Hispanic one.
That leaves Warren Bloom, Jeff Brown, and Jimmy DeLeon as candidates without instructive elections. Brown is spending a lot of money, and running on a platform that I expect to do better in the White Moderate bloc. Bloom has run six times before without making any ripples, and DeLeon is a… longshot.
The crowded lanes
Where does that leave us? We have three candidates who have done best in Black wards, Parker, Green, and Amen Brown; two candidates who have done best in Wealthy Progressive wards, Gym and Rhynhart; two we can expect to do best in White Moderate wards, Domb and Jeff Brown; one who’ll do best in the Hispanic bloc, Quiñones-Sánchez; and two without an electoral history, Bloom and Deleon.
Obviously these candidates won’t split the blocs evenly, so we can’t just divide the vote by the number of candidates. And winning will require doing well enough in other blocs to hit a winning profile. The candidates from At Large council–Green, Gym, and Domb–probably enter with the best name recognition, and might have higher baselines even in their worse blocs.
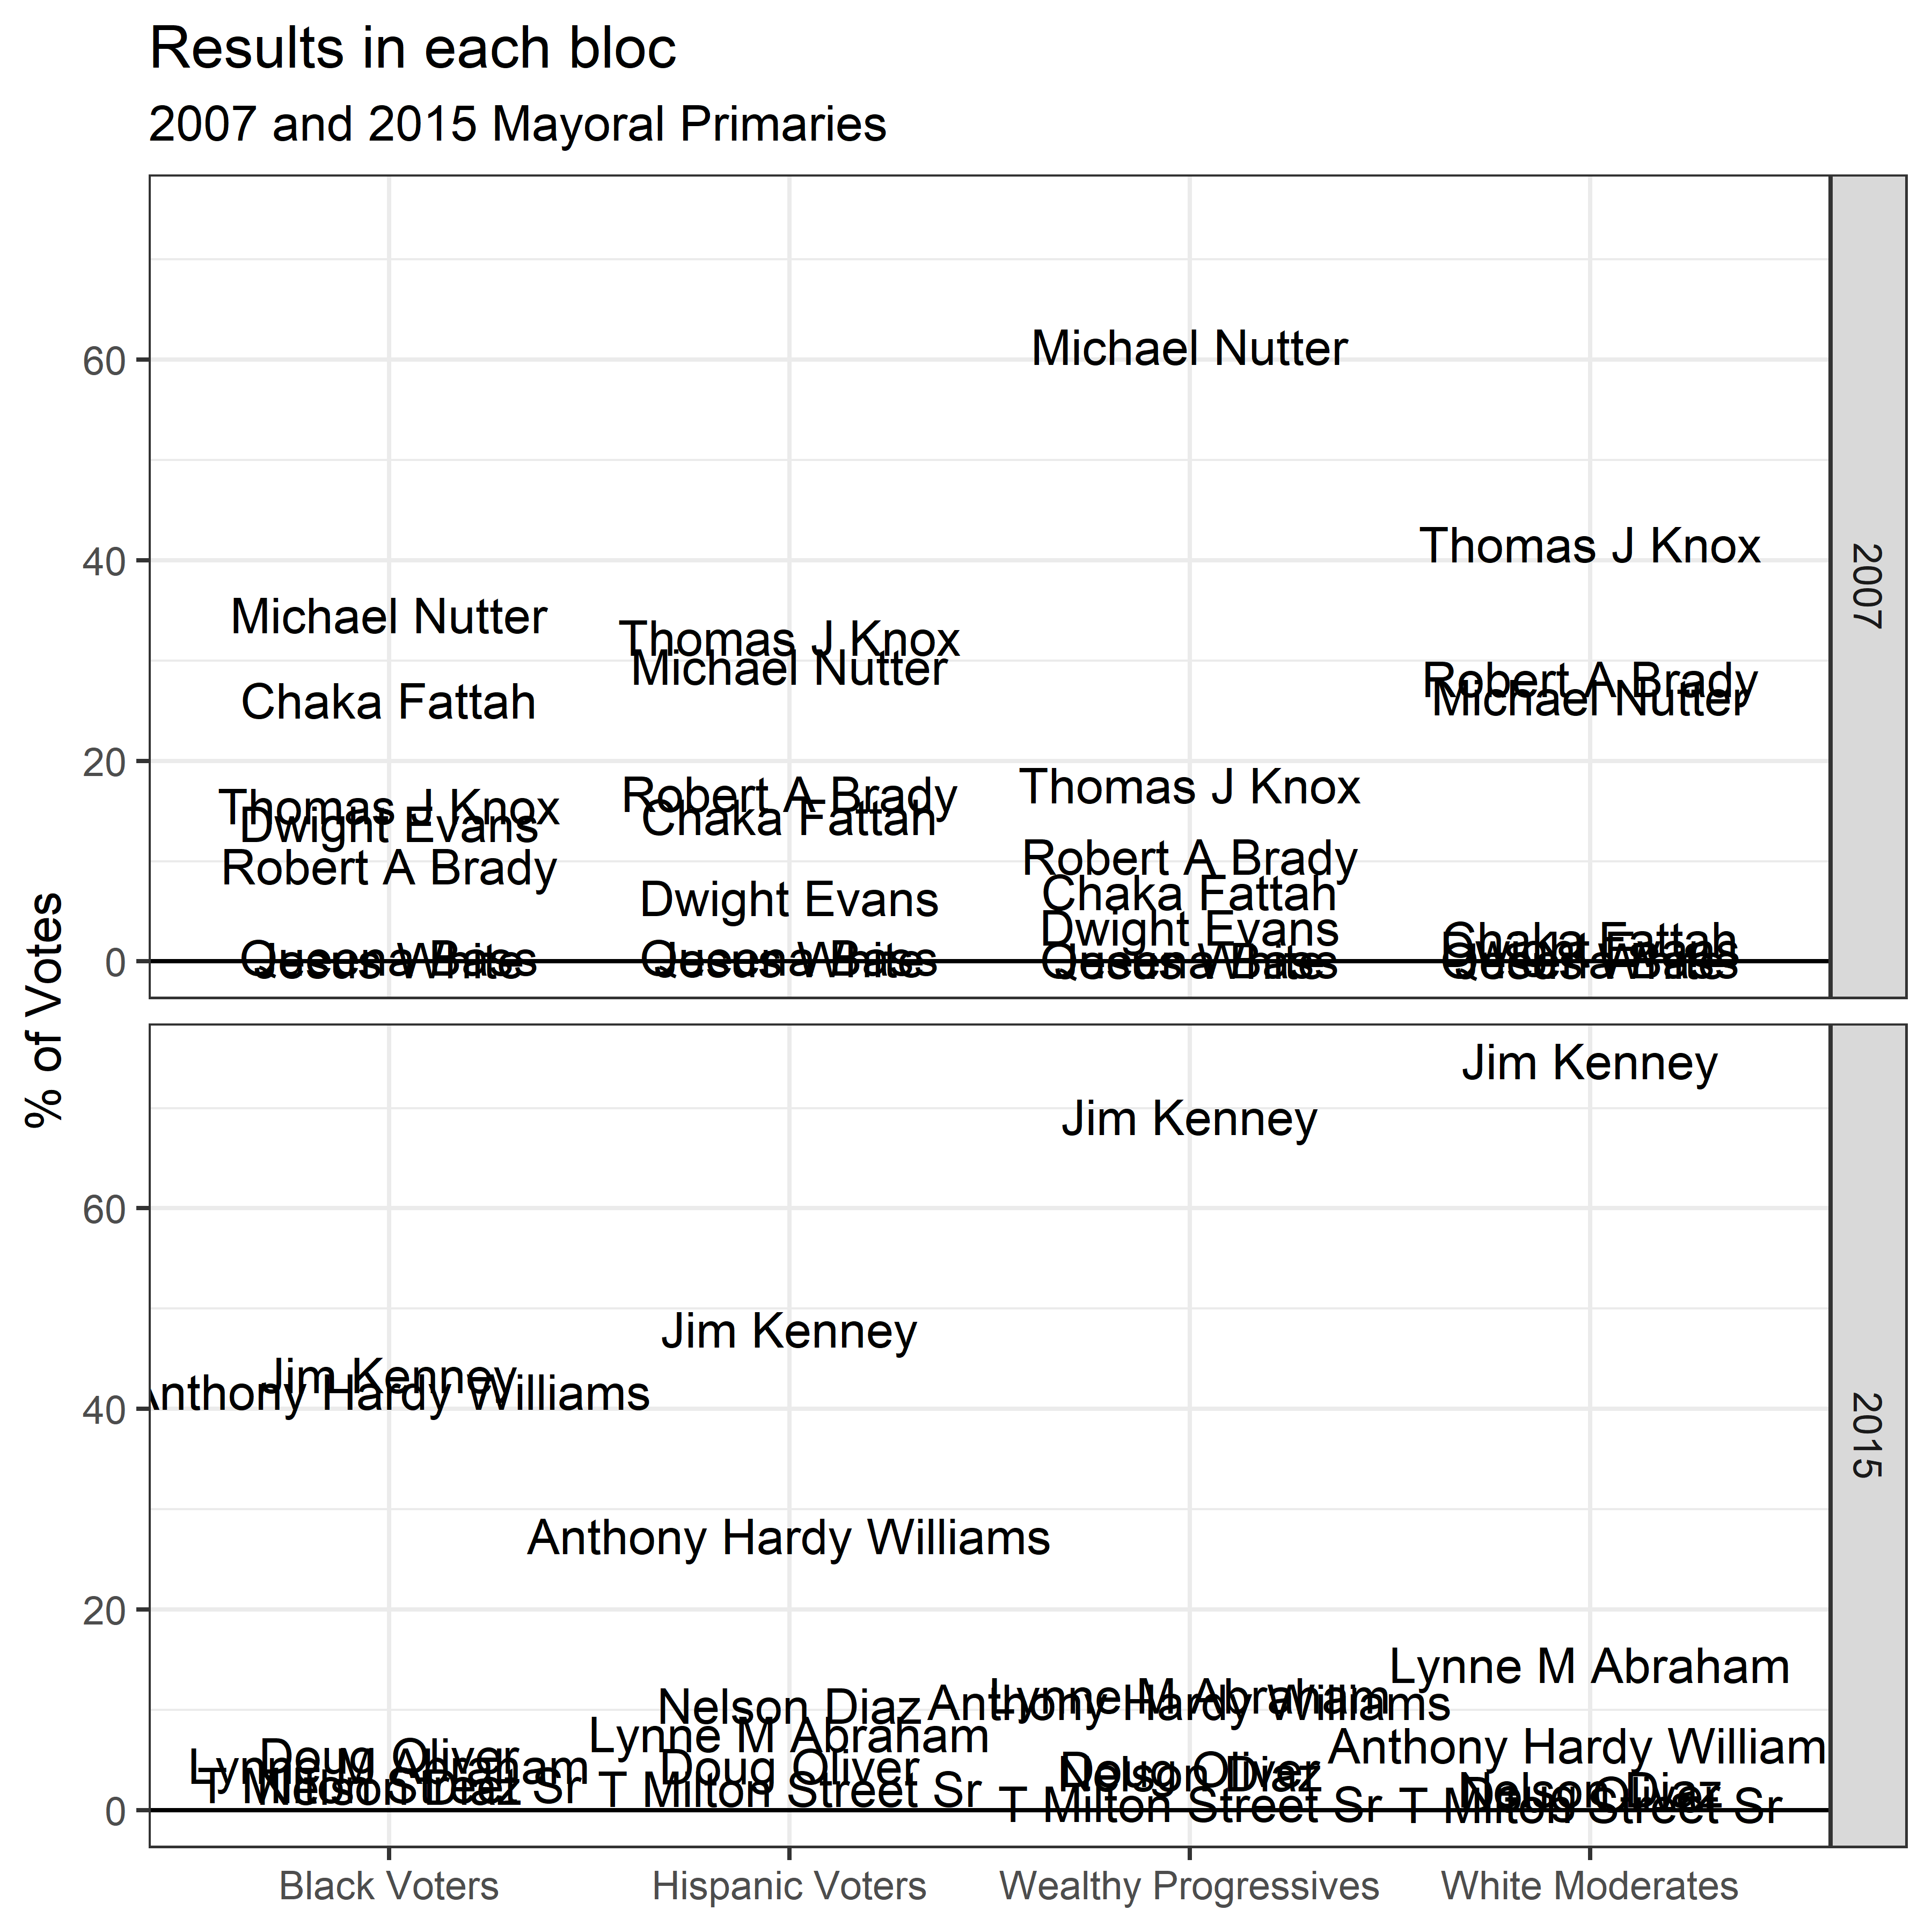
That was clear in the last two competitive mayoral primaries of 2007 and 2015. In 2007, Nutter dominated the Wealthy Progressive bloc, but also won the Black Voter bloc and broke 20% in White Moderate and Hispanic Voter blocs. In 2015, Kenney did best in the White Moderate and Wealthy Progressive blocs, but actually won in all of them. Both Kenney and Nutter were City Councilmembers.
View code
df_major %>%
  filter(
    office == "MAYOR",
    election_type == "primary",
    party == "DEMOCRATIC",
    year %in% c(2015, 2007)
  ) %>%
  left_join(div_cats %>% select(-year)) %>%
  group_by(cat, year, candidate) %>%
  summarise(votes=sum(votes, na.rm=TRUE)) %>%
  group_by(cat, year) %>%
  mutate(pvote = votes / sum(votes)) %>%
  ggplot(
    aes(x = cat, y=100*pvote)
  ) +
  geom_text(aes(label = format_name(candidate))) +
  facet_grid(year ~.) +
  geom_hline(yintercept=0)+
  theme_bw() +
  labs(
    x=NULL,
    y="% of Votes",
    title="Results in each bloc",
    subtitle="2007 and 2015 Mayoral Primaries"
  )
With petitions due soon and the race maturing, we will probably see several candidates drop out ahead of the election. That could help a candidate consolidate their bloc. Without drop-outs, though, this election would probably prove more fractured than 2007 and 2015. But the broader point holds: the winner will probably do well in two blocs, and well-enough in the rest.
