This May, Philadelphia will be voting for City Council. This includes five city-wide Democratic At Large positions. We don’t yet know exactly how many At Large candidates there will be, but in 2019 there were 28 names on the ballot.
In order to arrange those names on the ballot, we famously draw names from a coffee can.
In the past, I’ve demonstrated that our judicial elections are determined by the random luck of drawing a good ballot position: being in the first column nearly triples your votes, and is more important than a Democratic City Committee endorsement and Philadelphia Bar Association Recommendation combined). I even proposed an NBA-wheel style ballot procedure that would fix the problem.
I’ve wondered if the same effect exists for City Council. There are reasons to expect not: voters pay more attention to City Council races and candidates spend more money, so it’s less likely that a voter will just push a button in the first column. But with voters choosing up to five names out of a pool of around 28 candidates, it’s certainly plausible they’ll take shortcuts.
I tried this analysis in January 2019 but didn’t have quite enough data. This time around I’ve added in 2019’s 28 candidates, and can finally measure some effects.
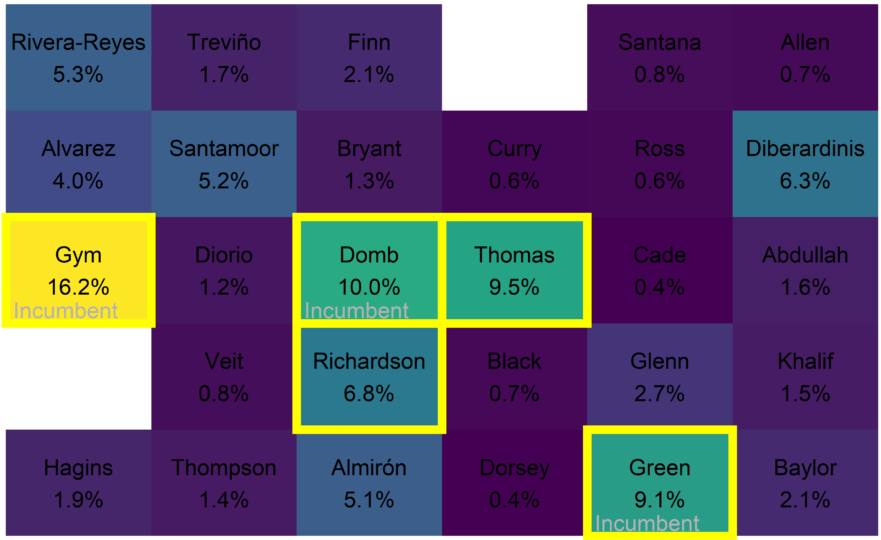
In 2019, all three incumbents plus Isaiah Thomas won handily. The fifth winner was Katherine Gilmore Richardson with 6.8% of the vote. Following her were Justin DiBerardinis with 6.3%, then Adrián Rivera-Reyes, Eryn Santamoor, and Erika Almirón at 5.3, 5.2, and 5.1% respectively.
View code
library(tidyverse)
library(sf)

source("../../admin_scripts/util.R")


setwd("C:/Users/Jonathan Tannen/Dropbox/sixty_six/posts/council_ballot_position_23/")
df_major <- readRDS("../../data/processed_data/df_major_type_20220523.Rds")
ballot_position <- read.csv("../../data/processed_data/ballot_layout.csv")

Encoding(ballot_position$candidate) <- "latin1"
ballot_position$candidate <- gsub("\\s+", " ", ballot_position$candidate)

format_name <- function(x){
  x <- tolower(x)
  x <- gsub("(\\b)([a-z])", "\\1\\U\\2", x, perl=TRUE)
  x <- gsub("(á|ñ|ó)([A-Z]+)", "\\1\\L\\2", x, perl=TRUE)
  x <- gsub("\\s+", " ", x)
  x <- gsub("(^\\s)|(\\s$)", "", x)
  return(x)
}

council <- df_major %>%
  filter(
    election_type == "primary",
      party == "DEMOCRATIC",
      office == "COUNCIL AT LARGE",
      year %in% c(2011, 2015, 2019)
  ) %>%
  mutate(year = as.integer(year))

council <- council %>%
  left_join(ballot_position, by = c("year" = "year", "candidate" = "candidate"))

council$candidate <- factor(council$candidate)
levels(council$candidate) <- format_name(levels(council$candidate))
council <- council %>% filter(candidate != 'Write In')

council <- council %>%
  group_by(year) %>%
  mutate(ncand = length(unique(candidate)))

total_results <- council %>%
  group_by(candidate, year, row, column, ncand, incumbent) %>%
  summarise(votes = sum(votes)) %>%
  group_by(year) %>%
  mutate(
    pvote = votes/sum(votes),
    winner = rank(desc(votes)) <= 5
  )

YEAR <- 2019
ggplot(
  total_results %>%
    filter(year == YEAR) %>%
    mutate(
      lastname=format_name(gsub(".*\\s(\\S+)$", "\\1", candidate)),
      lastname=ifelse(lastname == "Jr",format_name(gsub(".*\\s(\\S+\\s\\S+)$", "\\1", candidate)),lastname),
    ) %>%
    arrange(votes),
  aes(y=row, x=column)
) +
  geom_tile(
    aes(fill=pvote*100, color=winner),
    size=2
  ) +
  geom_text(
    aes(
      label = ifelse(incumbent==1, "Incumbent", ""),
      x=column-0.45,
      y=row+0.45
    ),
    color="grey70",
    hjust=0, vjust=0
  ) +
  geom_text(
    aes(label = sprintf("%s\n%0.1f%%", lastname, 100*pvote)),
    color="black"
    # fontface="bold"
  ) +
  scale_y_reverse(NULL) +
  scale_x_continuous(NULL)+
  scale_fill_viridis_c(guide=FALSE) +
  scale_color_manual(values=c(`FALSE`=rgb(0,0,0,0), `TRUE`="yellow"), guide=FALSE) +
  expand_limits(x=3.5)+
  theme_sixtysix() %+replace%
  theme(
    panel.grid.major=element_blank(),
    axis.text=element_blank()
  ) +
  ggtitle(
    paste(YEAR, "Council At Large Results"),
    "Democratic Primary, arranged by the ballot layout. Winners are outlined."
  )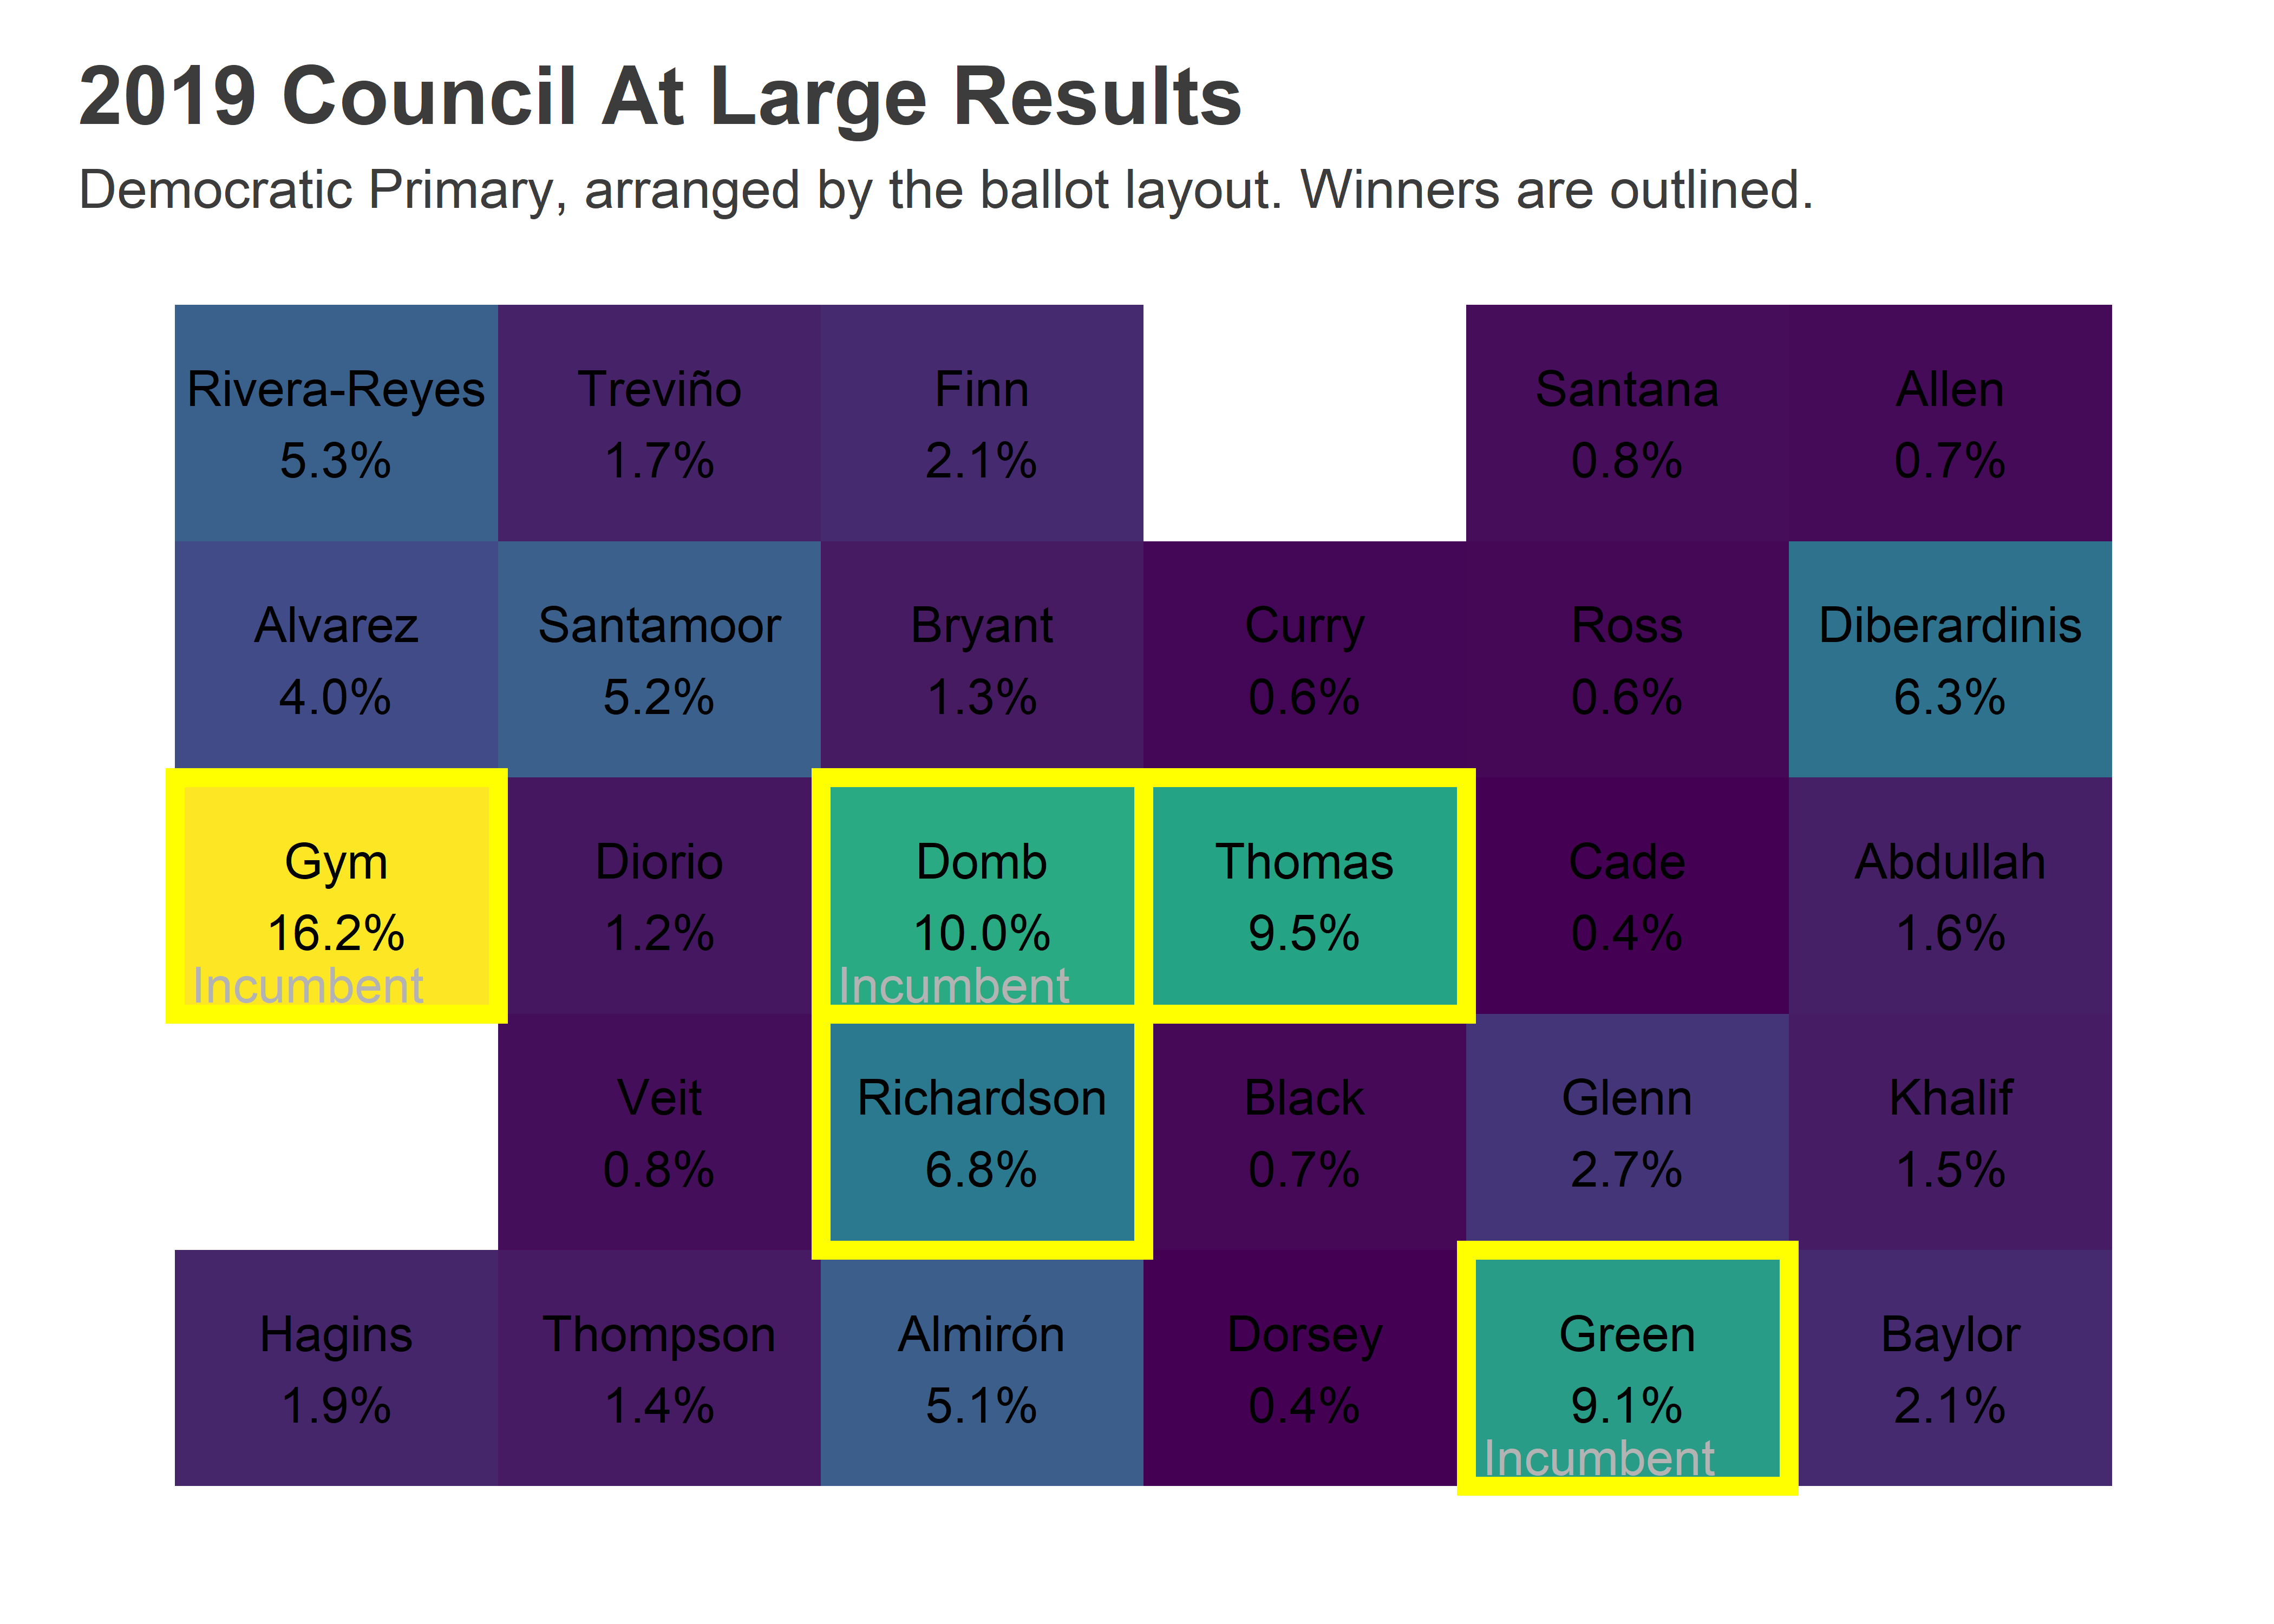
Ballot position appears weaker than for judges: many candidates win from later columns. Incumbency is obviously the strongest factor.
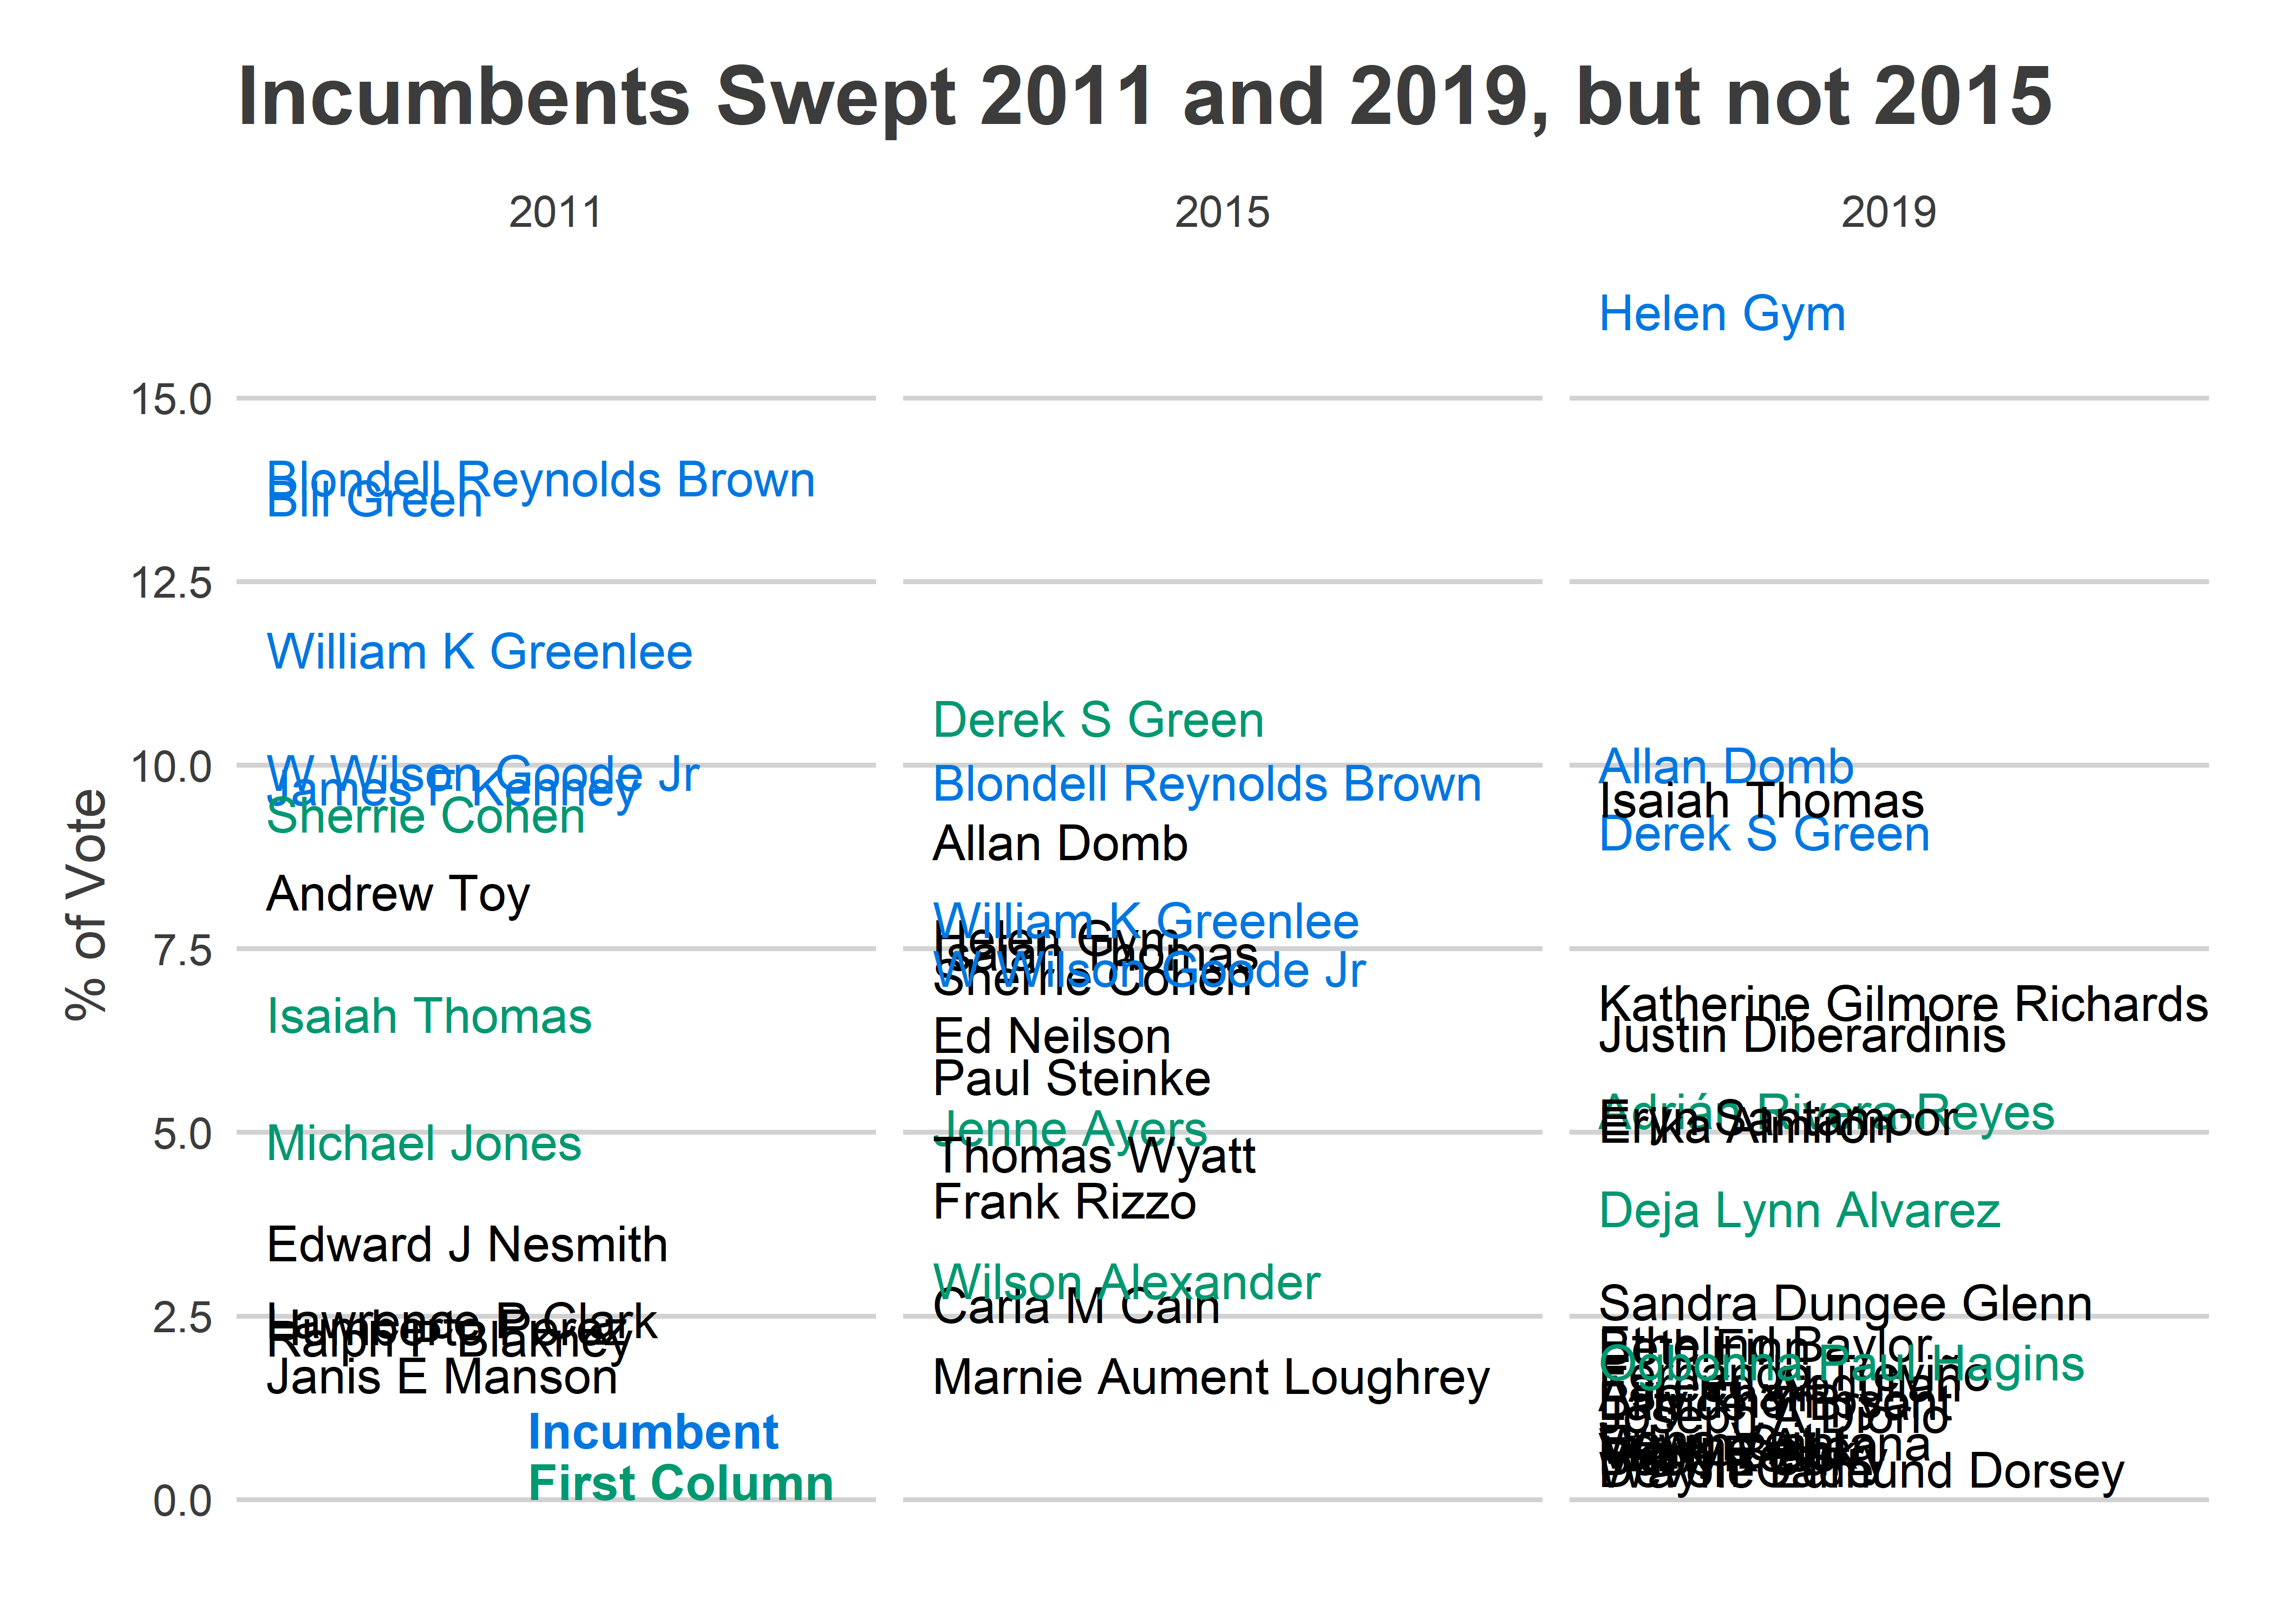
But looking farther back, we see instances where ballot position appears to help. In 2015, Derek Green led the entire field as a challenger with the top position. And in 2011 Sherrie Cohen came in a close sixth place from the first column, and two more first column candidates were in the top nine.
View code
ggplot(
  total_results,
  aes(y = 100 * pvote, color = interaction(incumbent, column==1))
) +
  geom_text(
    aes(label = candidate),
    x=0,
    hjust=0
  ) +
  facet_grid(. ~ year) +
  theme_sixtysix() +
  scale_y_continuous(breaks = seq(0,20,2.5)) +
  geom_text(
    data = tribble(
      ~votes, ~candidate, ~incumbent, ~year, ~pvote, ~column,
      # 1e3, "Challenger", 0, 2011, -0.007, 0,
      7e3, "Incumbent", 1, 2011, 0.007, 0,
      4e3, "First Column", 0, 2011, 0.000, 1
    ),
    fontface="bold",
    x=0.45,
    aes(label = candidate),
    hjust = 0,
    vjust=0
  ) +
  scale_color_manual(
    values=c(
      '1.FALSE' = strong_blue,
      '1.TRUE' = strong_blue,
      '0.FALSE'= "black",
      '0.TRUE'=strong_green
    ),
    guide = FALSE
  ) +
  expand_limits(y=0) +
  labs(
    title="Incumbents Swept 2011 and 2019, but not 2015",
    y = "% of Vote"
  )
Let’s use regression to tease apart the effects. I’ll regress the percent of the vote received by a candidate on being in the first column and being in the first row, incumbency, and year fixed effects. The regression is simplistic, but since ballot position is randomized we don’t need anything more. (The substantive findings below are robust to more controls and to using log(votes).)
View code
ols_fit <- lm(
  100 * pvote ~
    as.character(year) +
    incumbent +
    (row == 1) +
    (column == 1) +
    # (column == 1 & row == 1) +
    # (column == 1 & row != 1) +
    # (column == 2) +
    1,
  data = total_results #%>% filter(!incumbent)
)
# summary(ols_fit)

print_coef <- function(fit, coef){
  val <- round(ols_fit$coefficients[coef], 1)
  se <- summary(ols_fit)$coefficients[,2][coef]
  # stars <- case_when(p<0.01 ~ " (p < 0.01)", p < 0.05 ~ " (p < 0.05)", TRUE ~ "")
  se_text <- paste0(" (",round(se, 1),")")
  prefix <- (if(val > 0) "+" else "")
  paste0(prefix, val, se_text)
}

tribble(
  ~Effect, ~"% Vote in pp (standard error)",
  "Baseline Votes 2019", "2.6",
  "Incumbency", ols_fit %>% print_coef('incumbent'),
  "First Column",  ols_fit %>% print_coef('column == 1TRUE'),
  "First Row",  ols_fit %>% print_coef('row == 1TRUE')
) %>%
  knitr::kable("html") %>%
kableExtra::kable_styling(full_width = F)| Effect | % Vote in pp (standard error) |
|---|---|
| Baseline Votes 2019 | 2.6 |
| Incumbency | +6.4 (0.9) |
| First Column | +2.4 (0.9) |
| First Row | -0.3 (0.8) |
Non-incumbent candidates in the second or later column started with an average 2.4% of the vote in 2019. Incumbents on average receive 6.4 percentage points more votes. Candidates in the first column receive on average 2.4 pp more votes. Being in the first row doesn’t appear to help.
So the first-column effect for City Council is smaller than for Common Pleas, but still nearly doubles a typical challenger’s votes. And in 2019 it would have been enough to put any of the close challengers (Gilmore Richardson, DiBerardinis, Santamoor, Almirón) over the top.
Having worked and campaigned for a Councilman at large, positioning is important. It’s like candidate yard signs-which are kind of a big thing. They stake out territory. A voter committed to a candidate, or who takes the buck slip/goldenrod given by a party rep and votes in accordance knows what to do. But the hesitant, hurried, ignorant is likely to look at the first name he sees near the top. Oh, maybe that’s 3 or 4 in a hundred that make that snap decision. Like the 3 or 4 in a hundred who says “she must be a good candidate-look at all the yard signs for her in my neighborhood”.
Sure it matters. It’s those 3 votes out of a 100 that matter in a tight race.