This was Pennsylvania’s first election with no-excuse mail-in voting. Thanks to Covid-19, a whopping 140,393 mail-in votes were recorded, out of a total turnout of 348,740. That use of mail-in wasn’t uniform, though. It was dominated by what I’ve called the Wealthy Progressive Divisions.
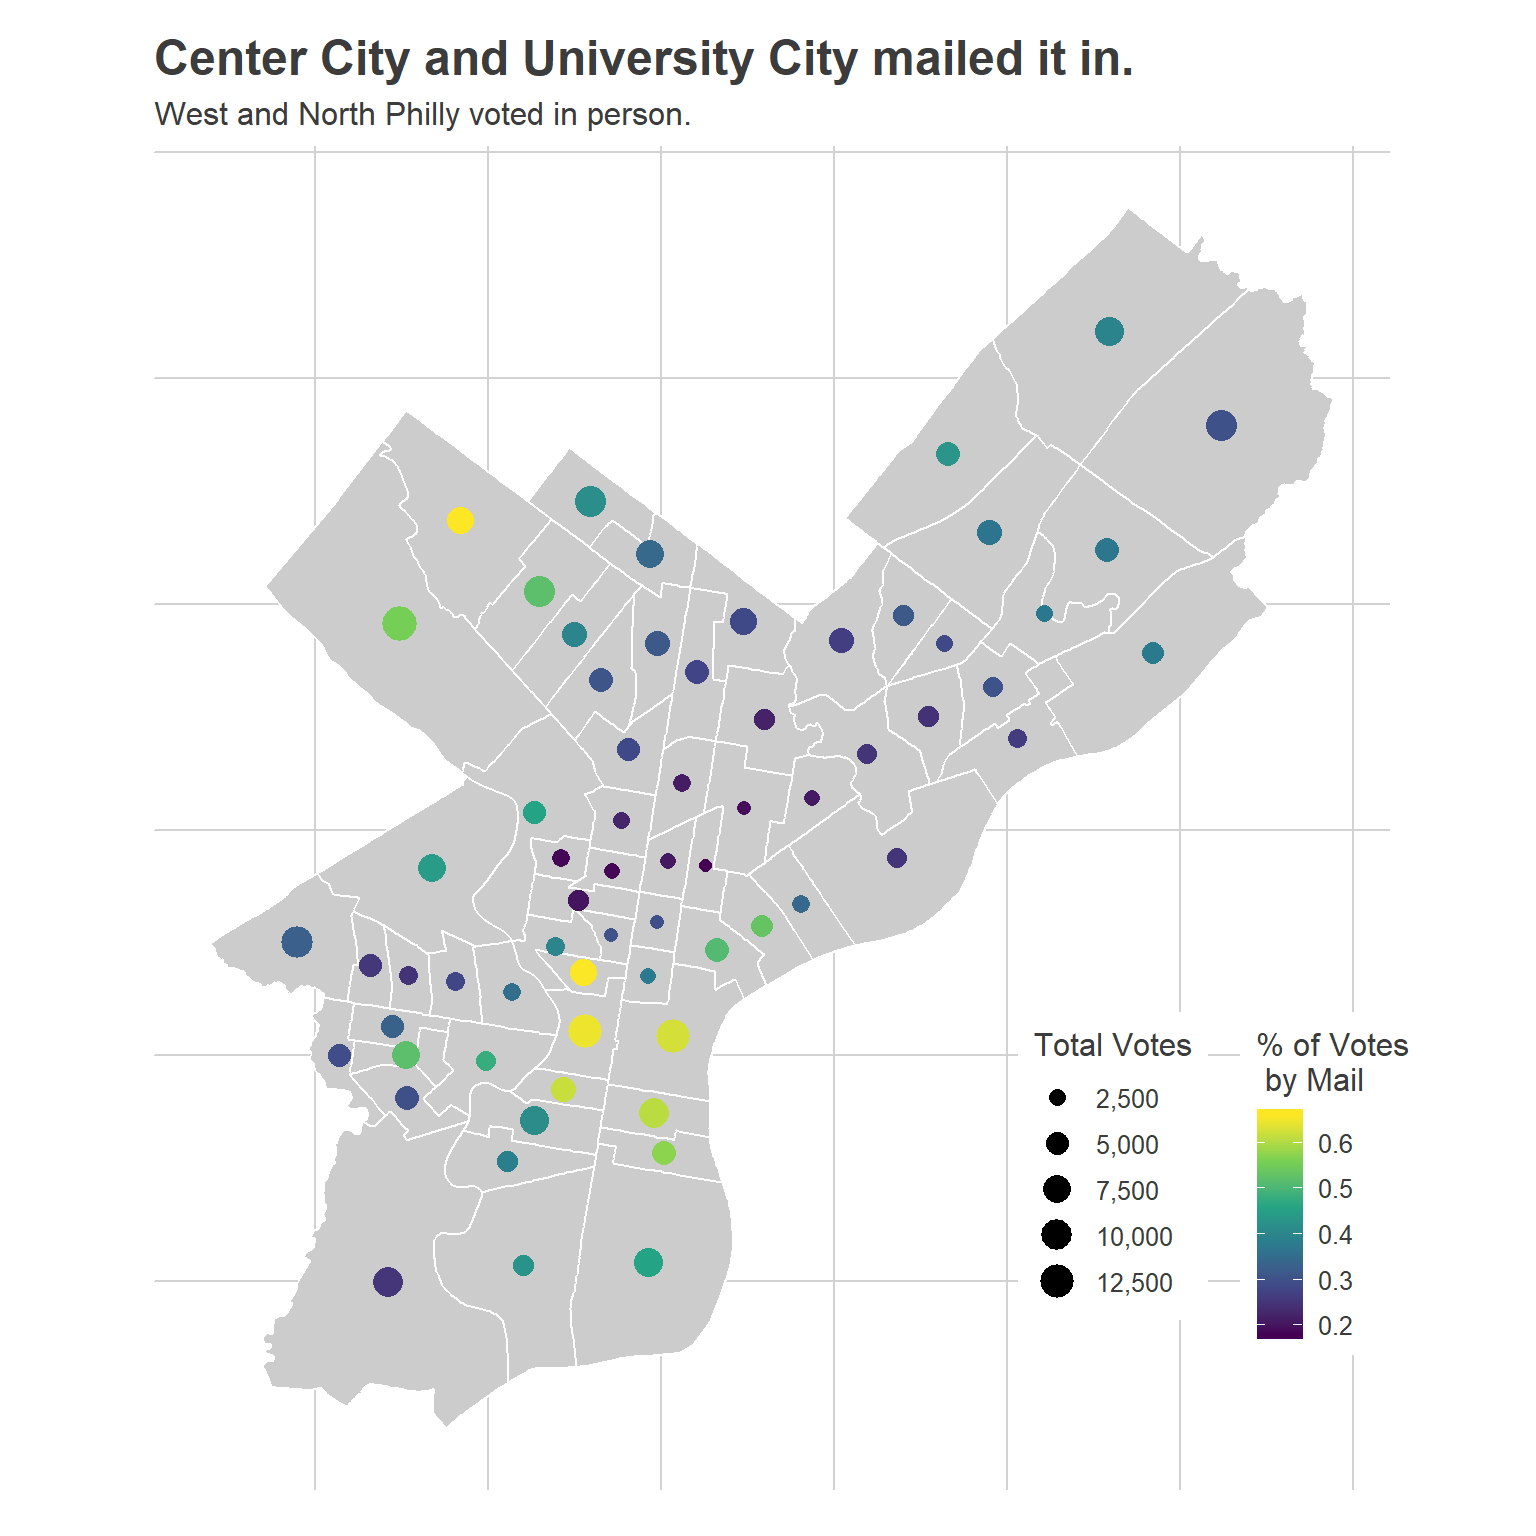
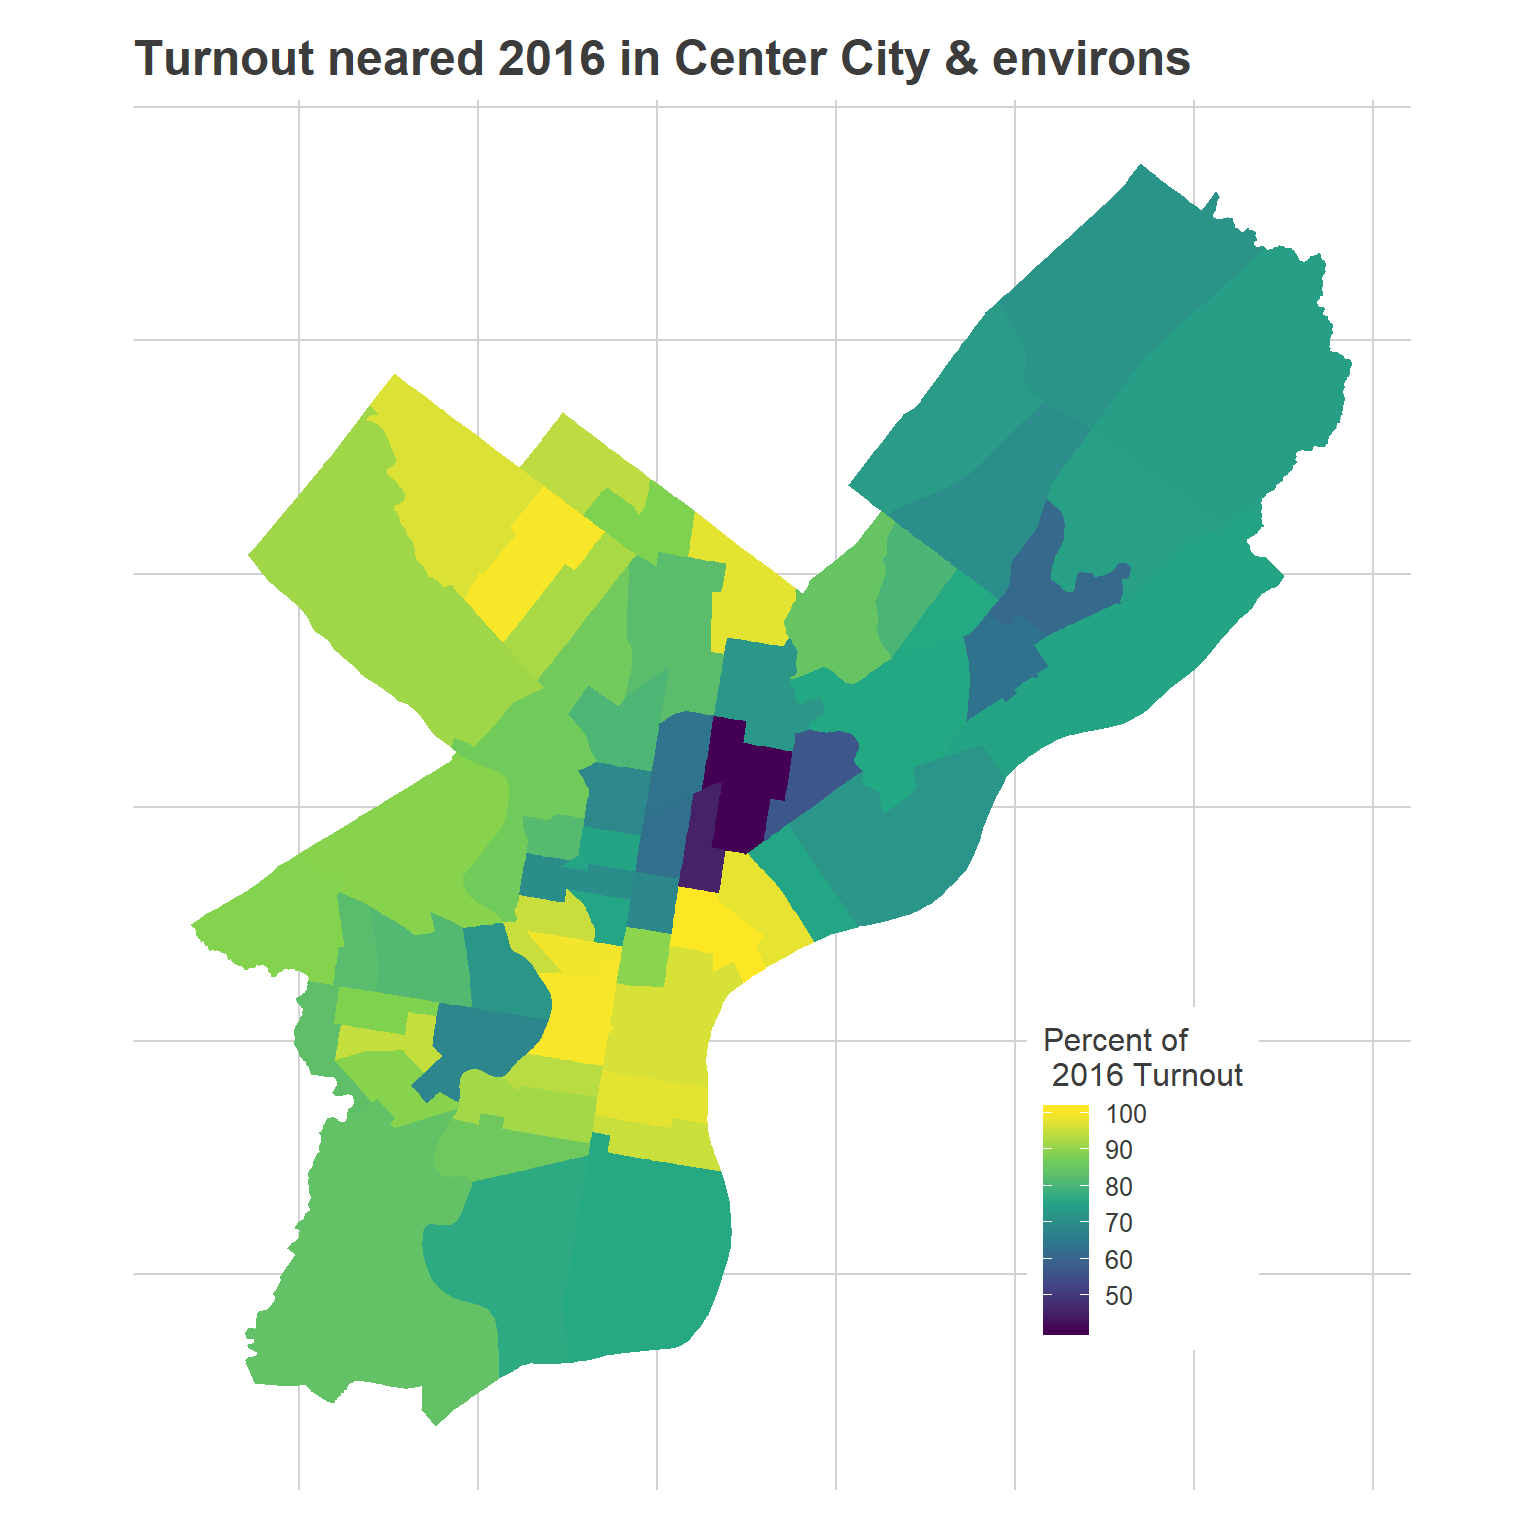
Overall, the 349K votes cast fell just short of 2016. Among those 349K voters, there were 330K votes cast for a presidential candidate. That compares to 395K votes cast in 2016. (I don’t have the Public Count for 2016, which is why I’m focusing on votes cast for president.)
West Philly’s 188th
As you’d expect, the turnout was higher in wards with competitive State Senate and House races. Slightly more surprising, the mail-in votes looked very different from the in-person. Consider West Philly’s PA-188, where Rick Krajewski beat incumbent Jim Roebuck.
Krajewski won 34.5% of the 5,419 votes cast on Election Day, to Roebuck’s 29.4%. But he won 56.6% of the 6,404 mail-in ballots that would eventually be counted, and Roebuck only 24.8%.
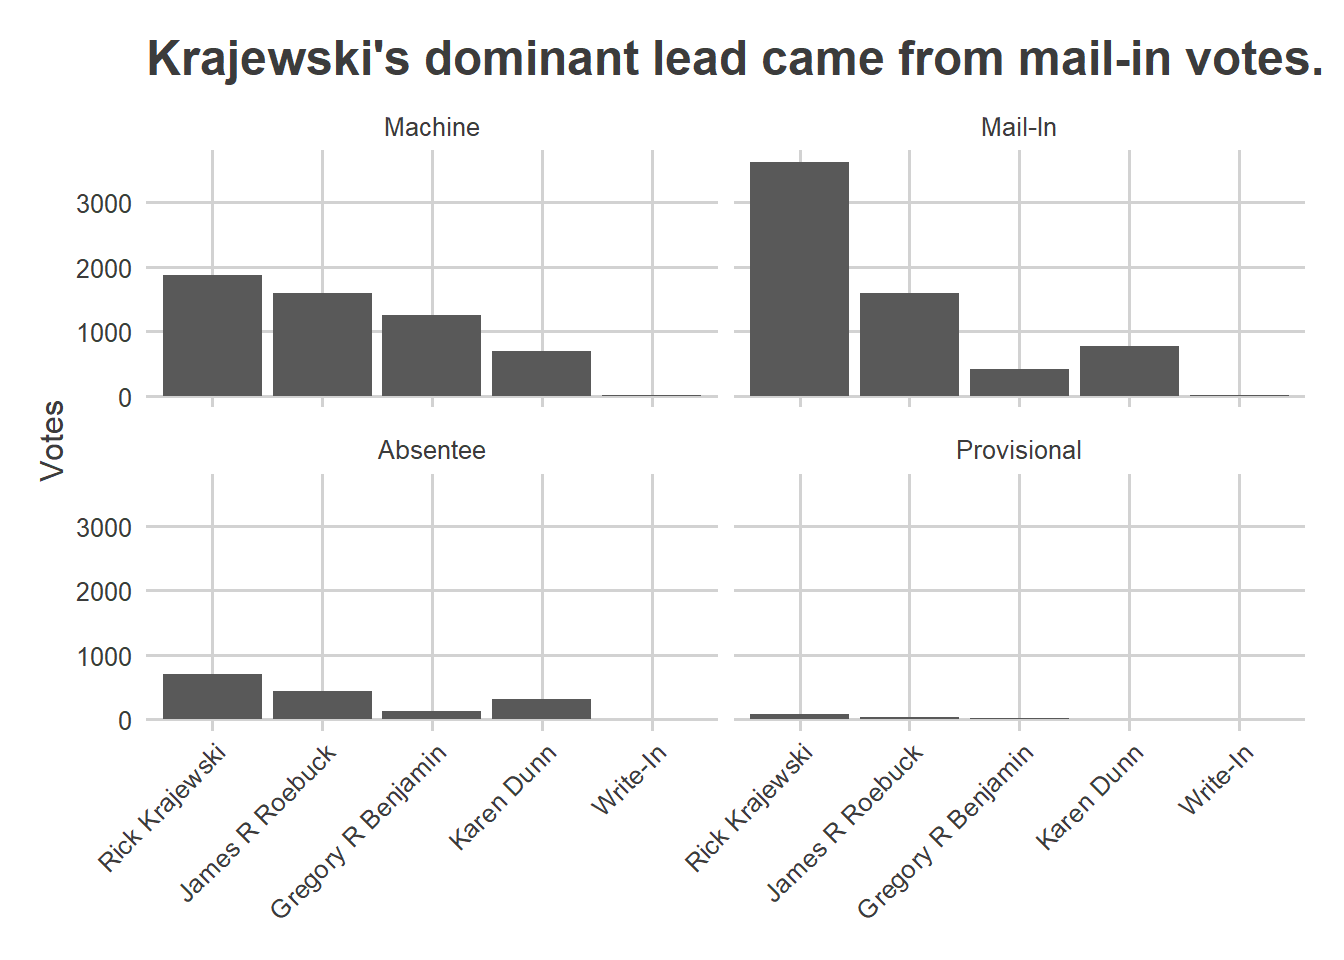
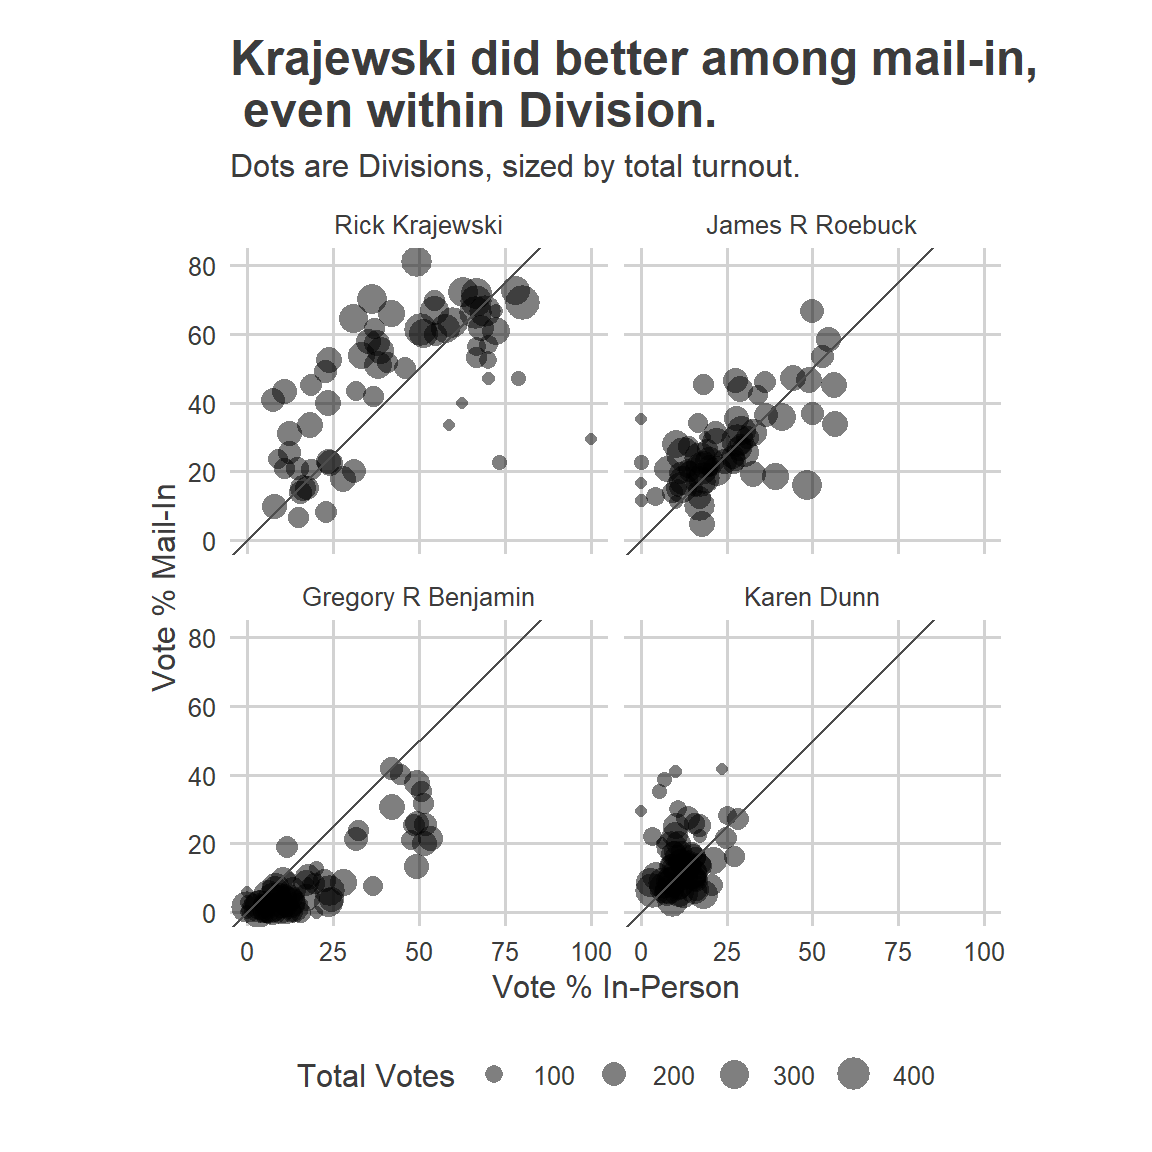
That difference was a function of two things: high-mail-in Divisions were more likely to support Krajewski, but also even within a Division, mail-in voters were more likely to support Krajewski than in-person voters.
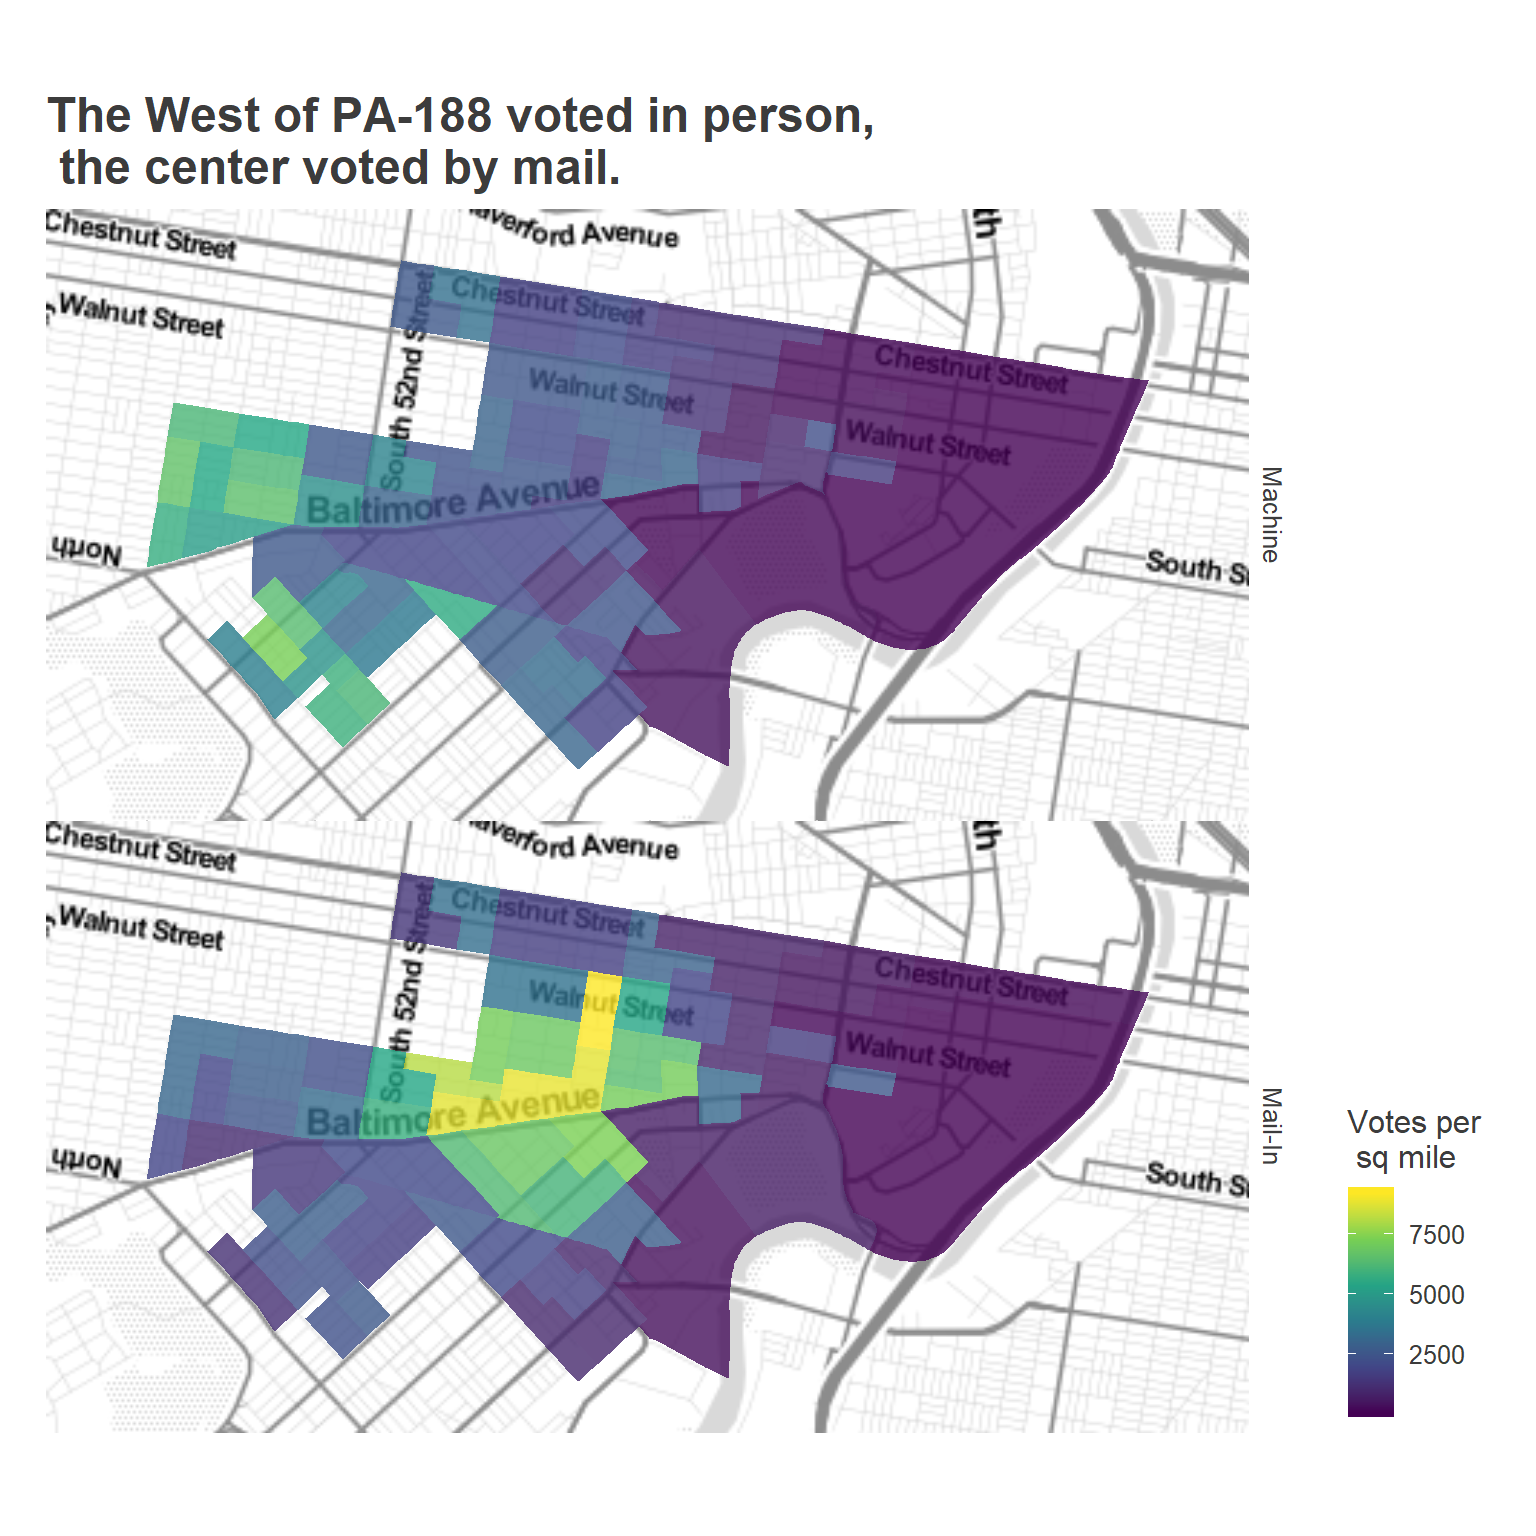
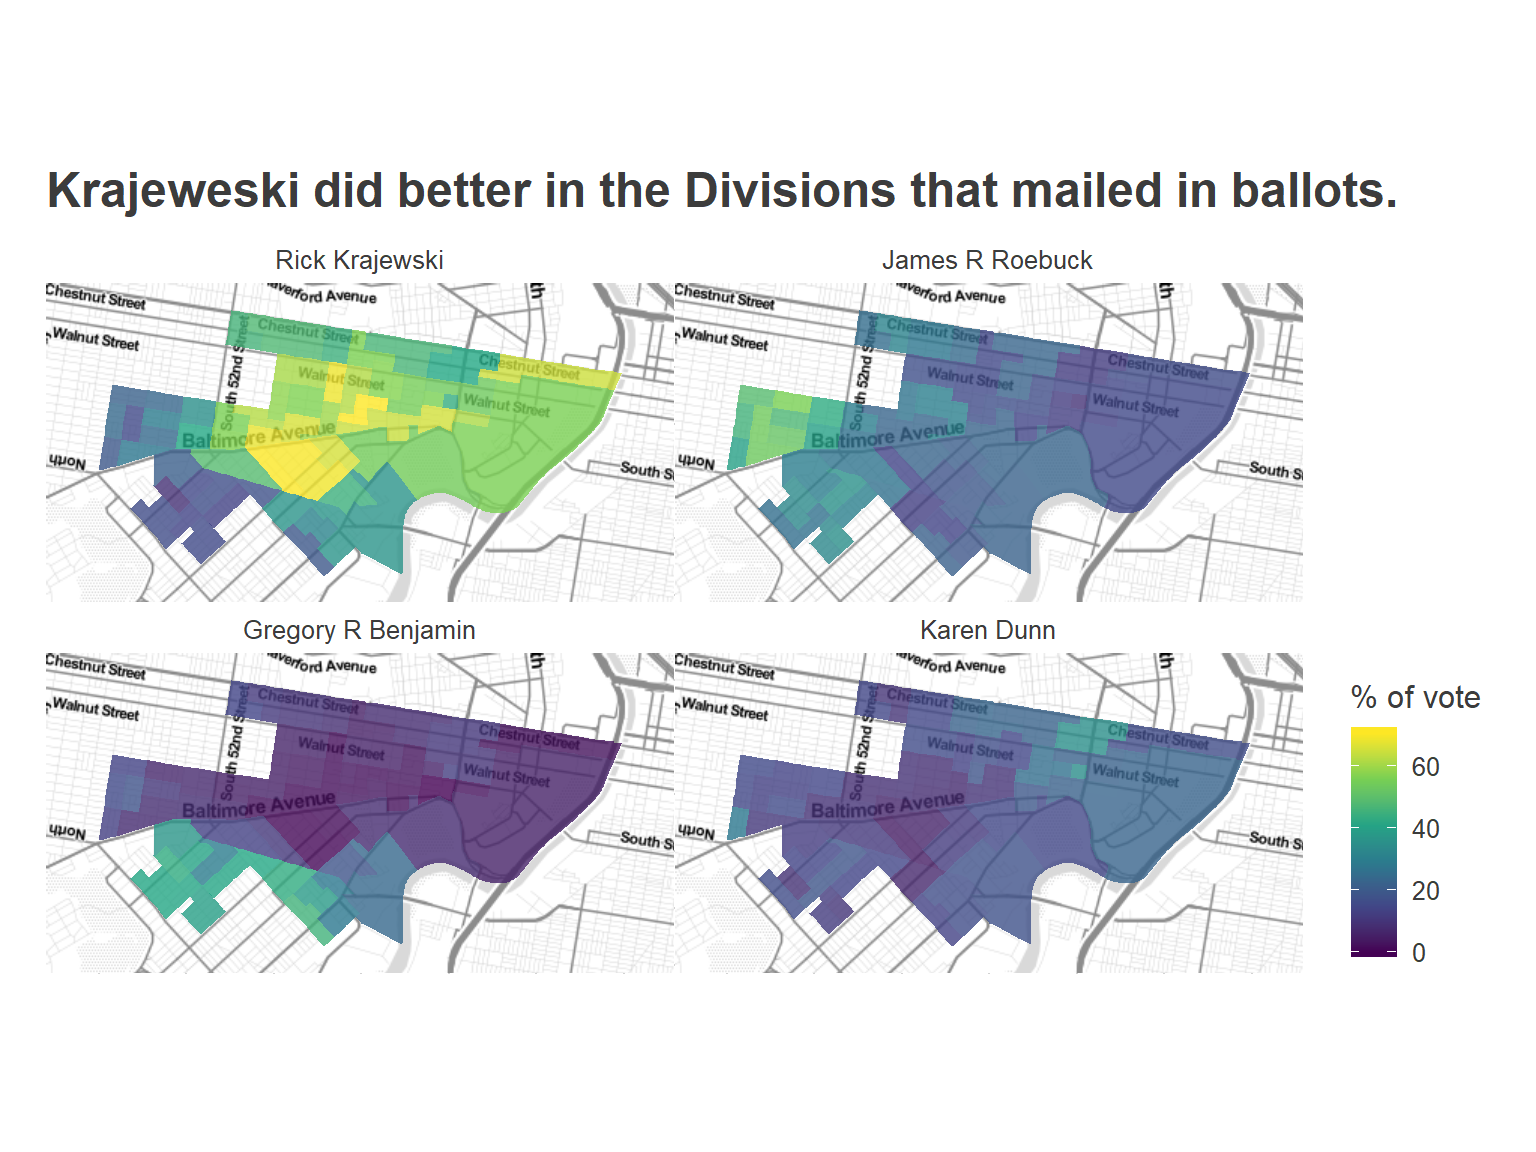
This correlation between Krajewski’s vote share and mail-in support is probably because (a) Krajewski’s support was strongest among the left, gentrified Divisions, the same group of people who would vote by mail across the city, but also (b) a concerted effort by the campaign to get their supporters to mail in ballots. My hunch is much more the former than the latter.
But even within Divisions, the mail-in votes were more supportive of Krajewski than the in-person. On average, Krajewski did 3.9 percentage points better on mail-in votes than on in-person votes in the same division (Roebuck did exactly the same on each, Benjamin and Dunn did better on in-person). This may still be a selection effect, where the types of people who mailed in their ballot ahead of time were more likely to support Krajewski. Notice that 3.9 is a tiny fraction of the 22 point difference Krajewski had between mail-in and in-person (56.5 minus 34.5); the other 18 points of the gap was due to the across-division correlation between mail-in votes and where Krajewski performed well.
The race for PA-01
Now consider State Senate PA-01, covering Center City and its North and South.
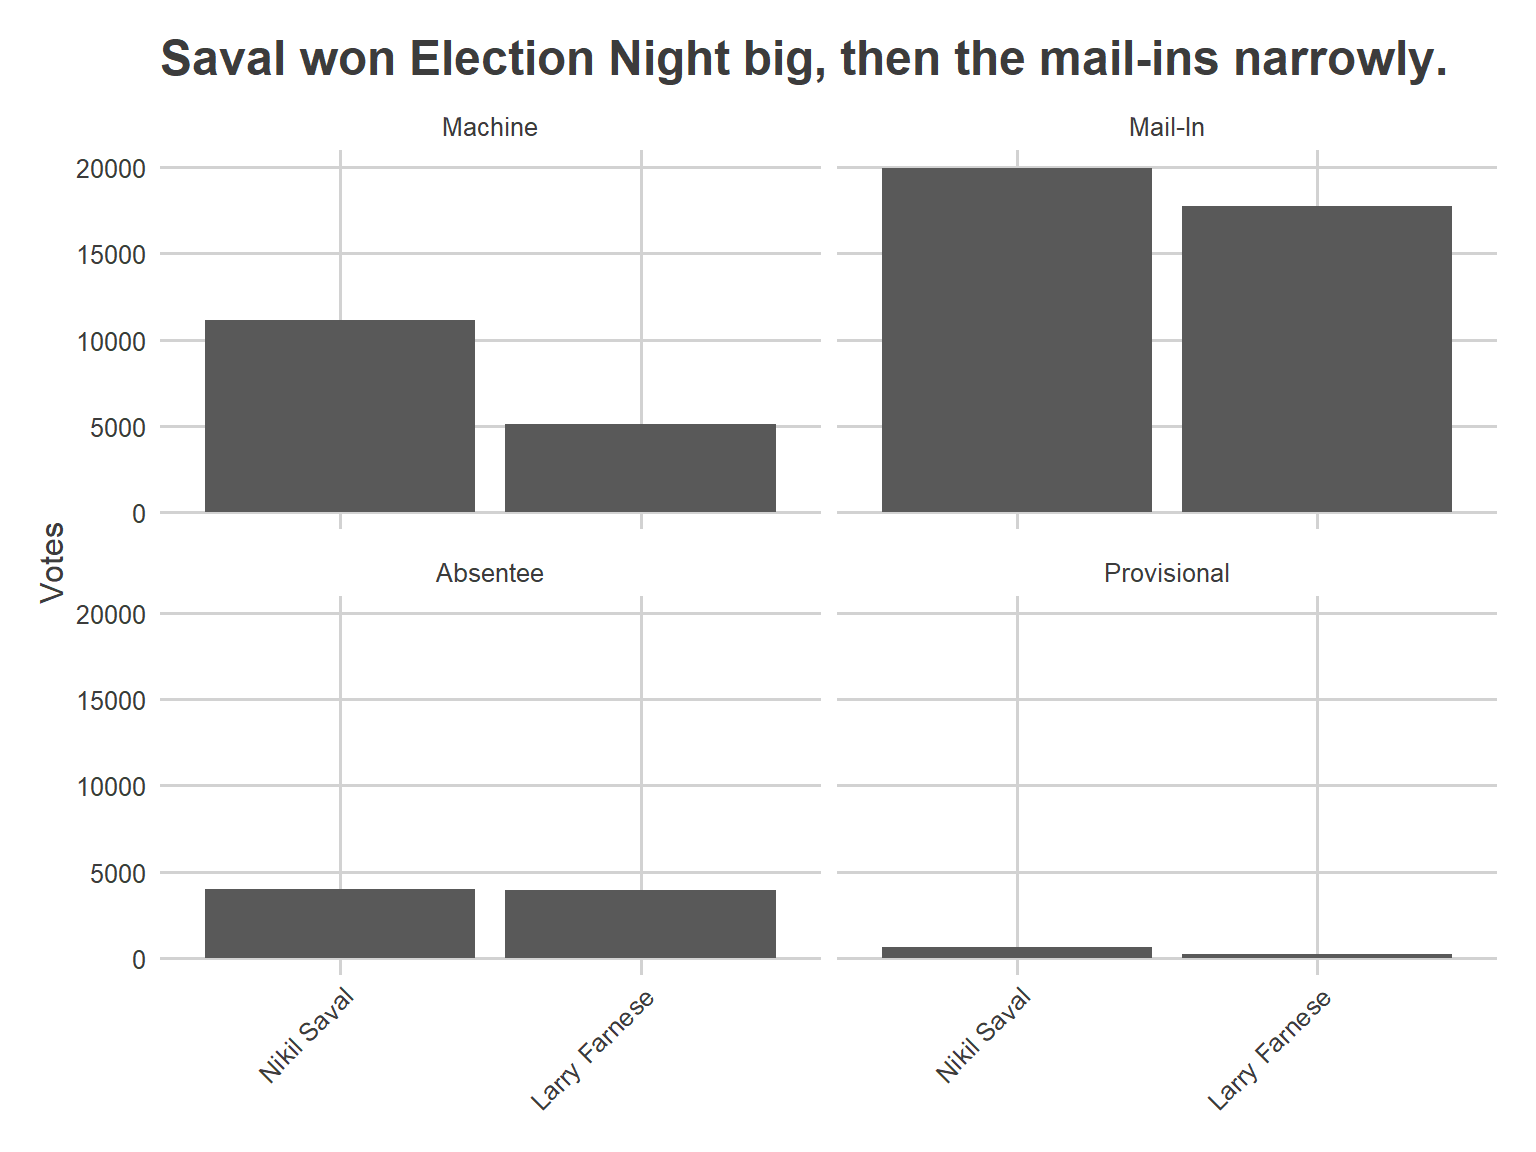
Saval won 68% of the 16,275 votes cast on Election Day, to Farnese’s 32%. But in this district, 60% of the votes were mail-in, and another 13% were absentee, and they were much closer than the in-person. Saval finished Election Night with a huge lead. As the mail-in votes were counted, the race would become a lot closer.
Saval won only 53% of the mail-in votes, to Farnese’s 47%, and Farnese eked out absentees 50.5 to 49.5. While close, Saval still managed to win mail-ins outright, and certainly avoided losing his Election Night lead.
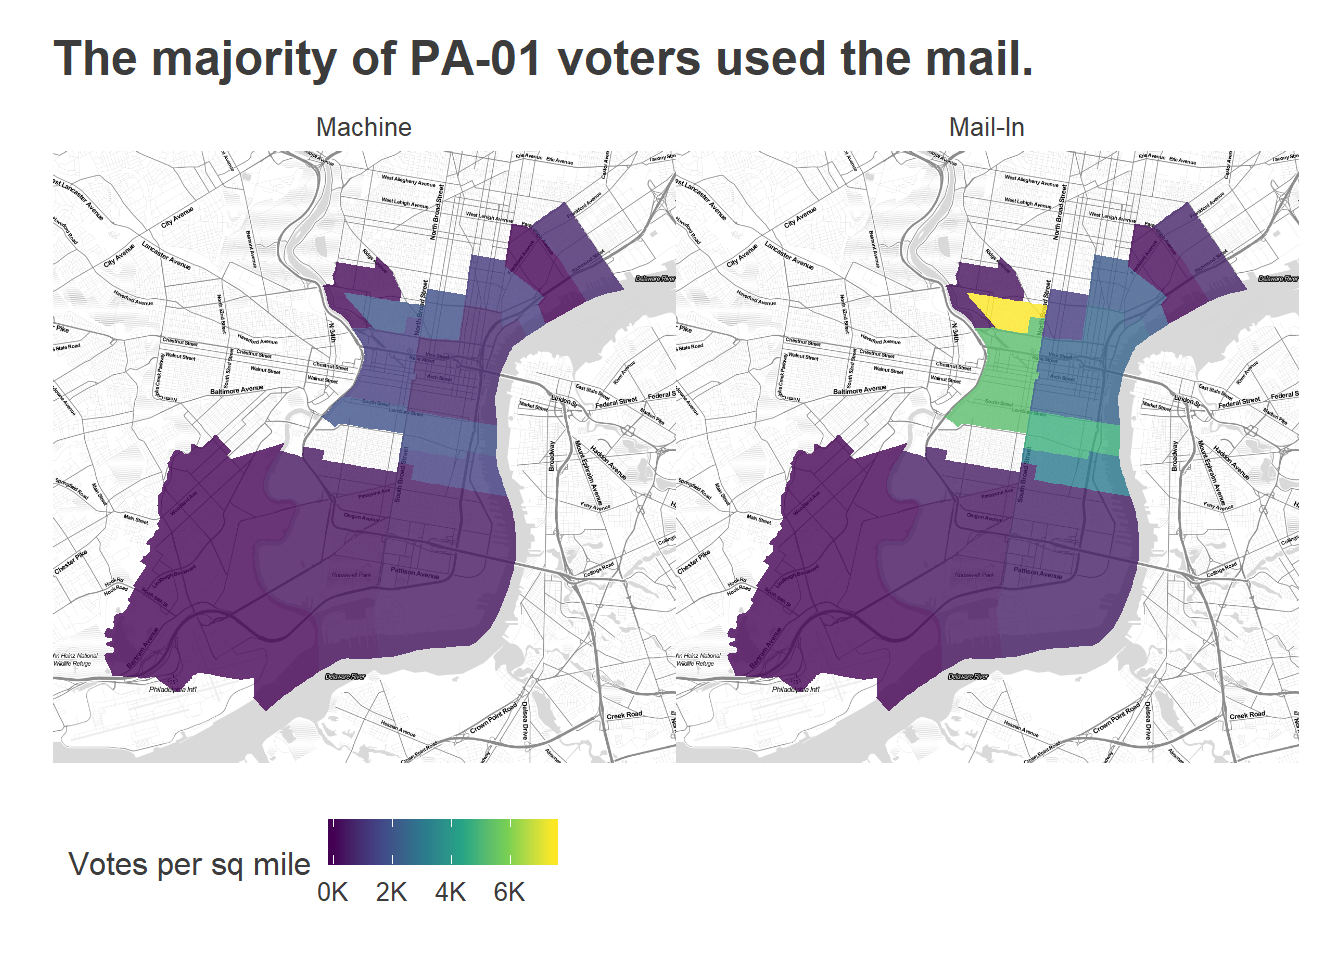
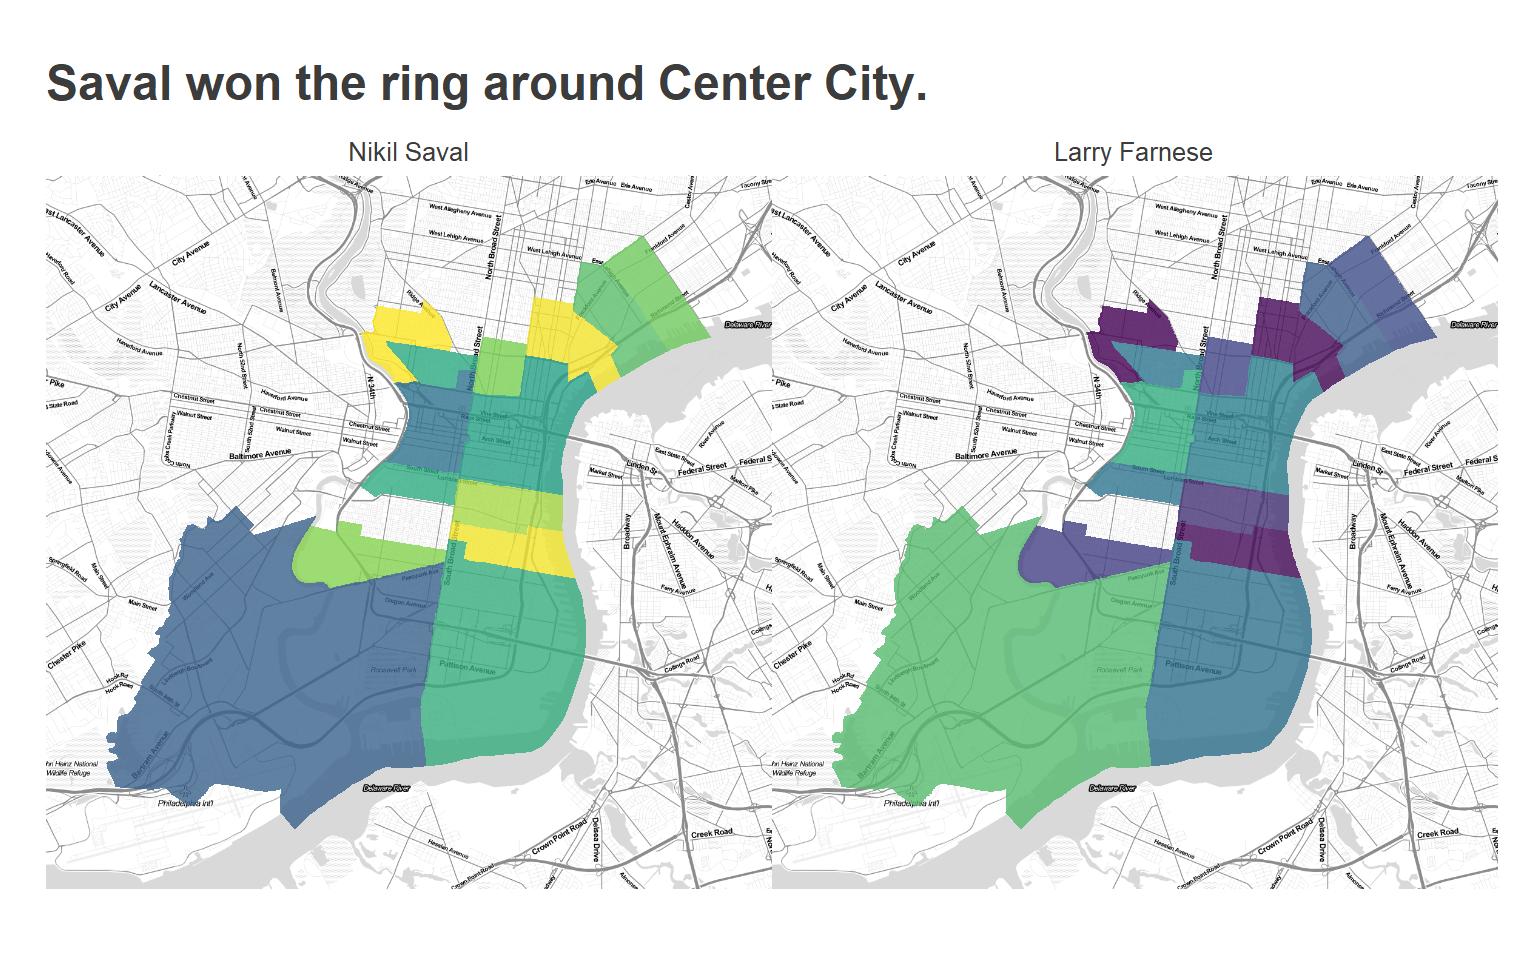
Saval performed significantly better in the ring around Center City; he won 61% of the vote outside of Center City’s 5th and 8th Wards. He won only 53% of the vote in Center City East’s 5th, and Farnese won 56% of the vote in Center City West’s 8th, the ward he leads. Those regions represented 68%, 16%, and 16% of the districts turnout, respectively.
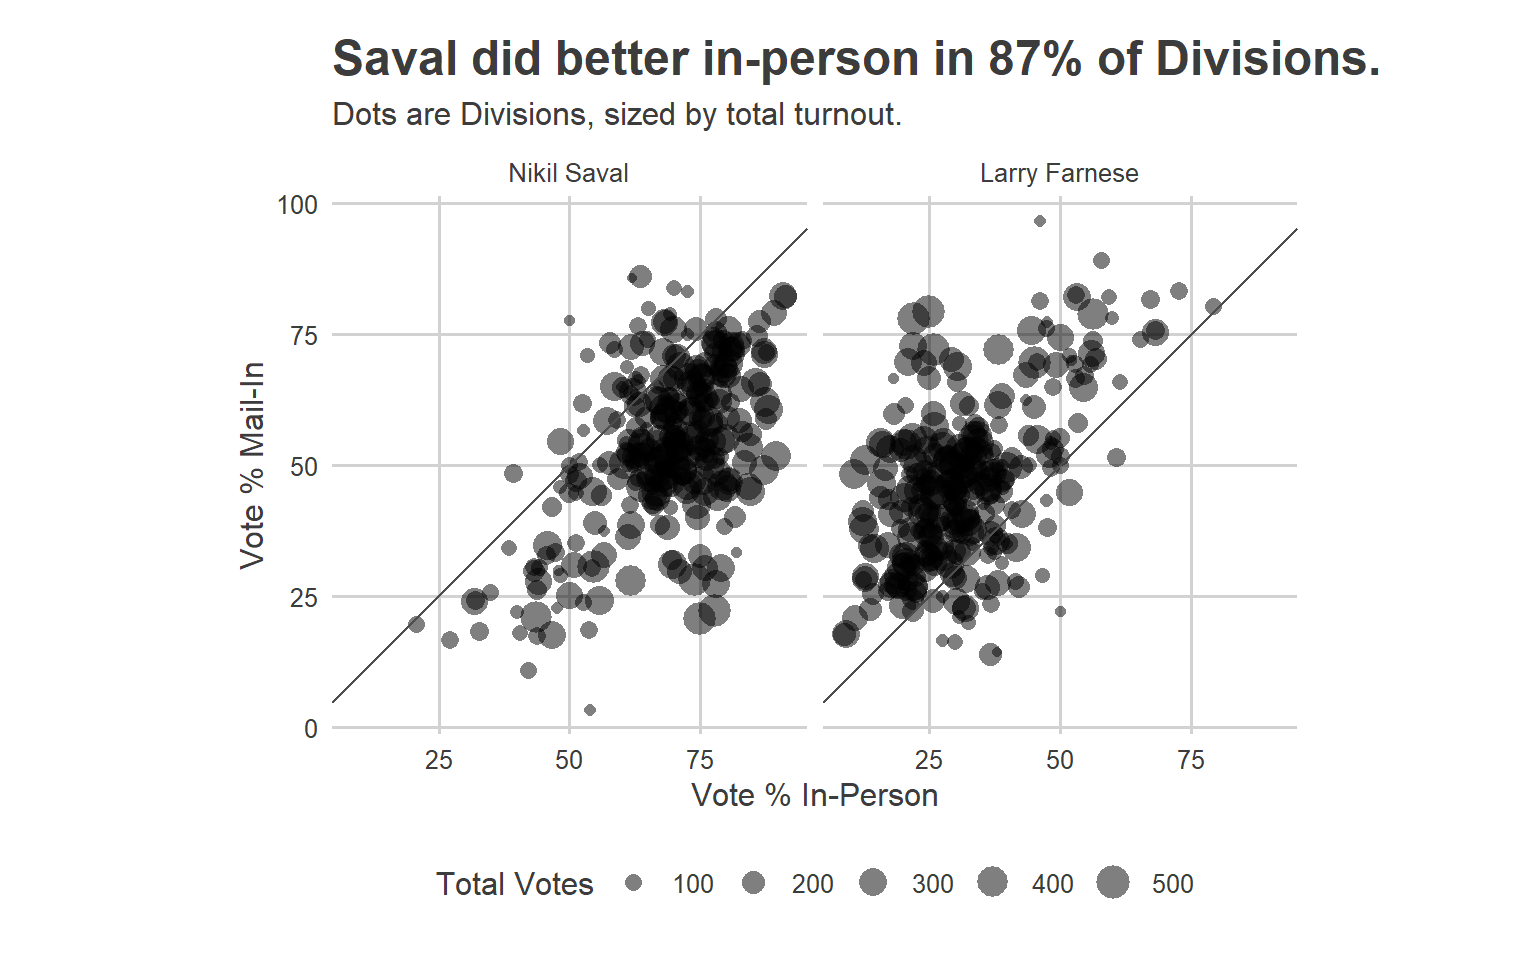
Within divisions, Saval did 9 percentage points better on in-person votes than he did on mail-in. That’s more than half the 15 point overall difference he had between mail-in and in-person (68 minus 53); the other 6 points come from the fact across divisions in-person turnout correlated with where he did better.
More to come
There are plenty of questions left about how mail-in voters were different from in-person voters, and I’ll do a deep dive once the person-level turnout is released. Stay tuned!
Fascinating analysis.
Bug on the first chart: 0.6% -> 60%.
Or it should be “Fraction of the vote is 0.6”
There are some signs that mail-in voting could get be potentially very messy and/or bad for the Democrats.