US Congressman Bob Brady stunned Philadelphia yesterday when
he announced that he would not run for reelection. This puts Congressional District 1, which he has held since 1998, up for grabs. Immediately, the scramble among Democrats to pursue the seat began.
In November, the seat will almost certainly be won by the Democrat. But who can win the Democratic Primary in May? Is the district ripe for pick-up by a progressive change candidate? Or will Brady, who is also president of the Democratic City Committee, be replaced by another Party stalwart?
What should we expect from the district? Where do its votes come from, and what do we know about those voters? Let’s look at some maps. (You can visit my interactive maps, too).
EDIT: This may obviously all be moot if the district changes in response to the State Supreme Court’s map overturn…
District 1 stretches from Northeast Philadelphia, through South and Southwest Philly, and down into Media. The gerrymandering is obvious: the southeast stretch encompasses Chester and Swarthmore, which get grouped in with Philadelphia in hopes of concentrating Democratic votes and thus wasting them.
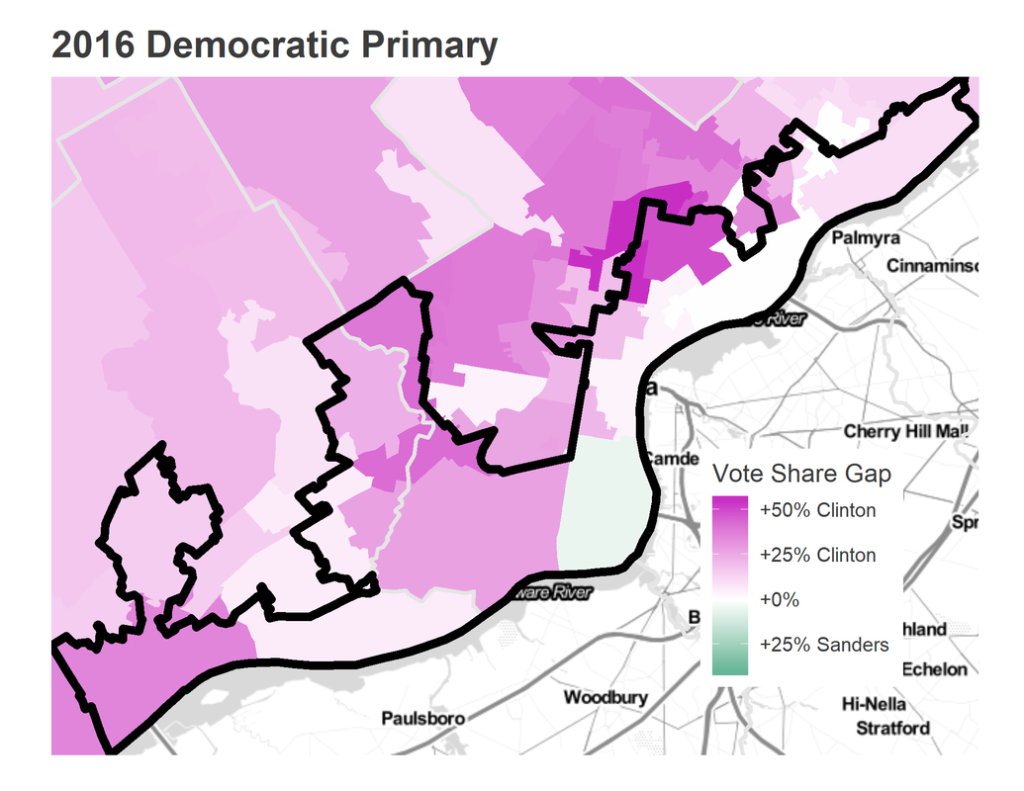
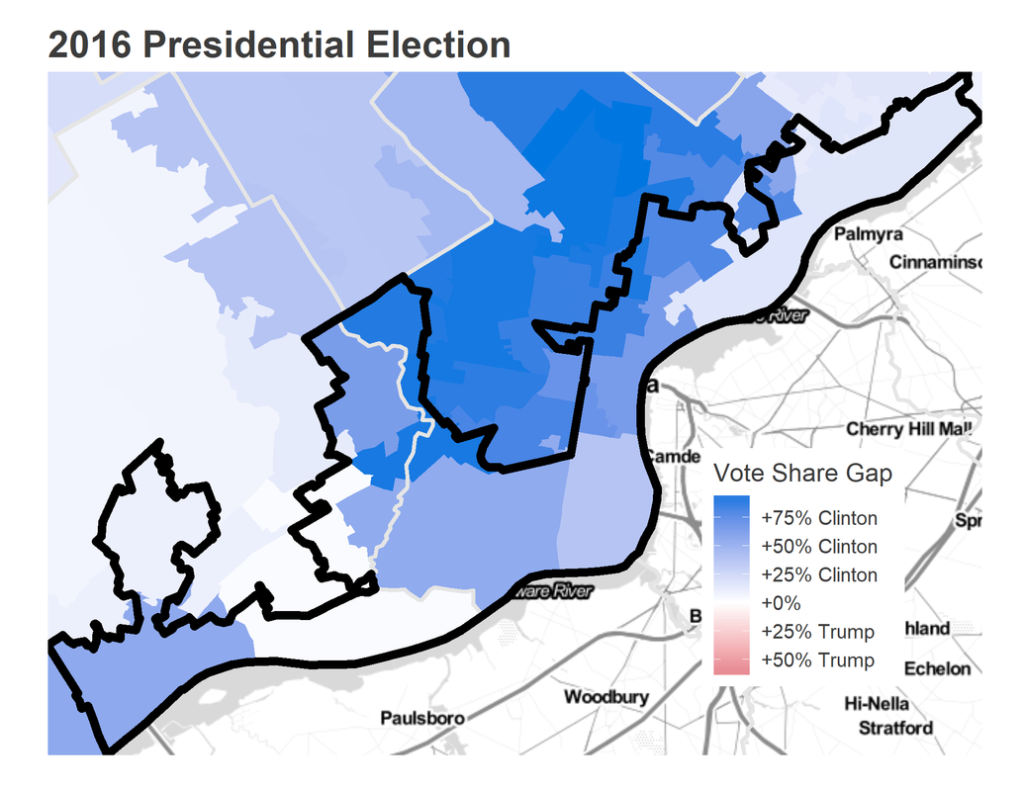
The district is a completely safe Democratic seat. Clinton won it in 2016 with 80% of the vote. Below, I’ve aggregated votes to State House districts. Interestingly, the River Wards and parts of South Philly that may be considered Brady’s base were the Trumpiest Democrats, swinging sharply for the Republican.
So the Democrat will almost certainly win in November. But what kind of Democrat will it be? Does the district seem to prefer establishment, Clinton types, or leftist, Sanders types? The voters are actually quite diverse in this regard, combining Black and Hispanic neighborhoods that voted entirely for Clinton in North and West Philly and Chester, with River Wards and South Philly neighborhoods that voted for Sanders. (I continue to find fascinating the overlap between Sanders and Trump voters, suggesting that voters may not have been Left or Right so much as Anti-Clinton. I leave it to you to speculate on the reasons.)
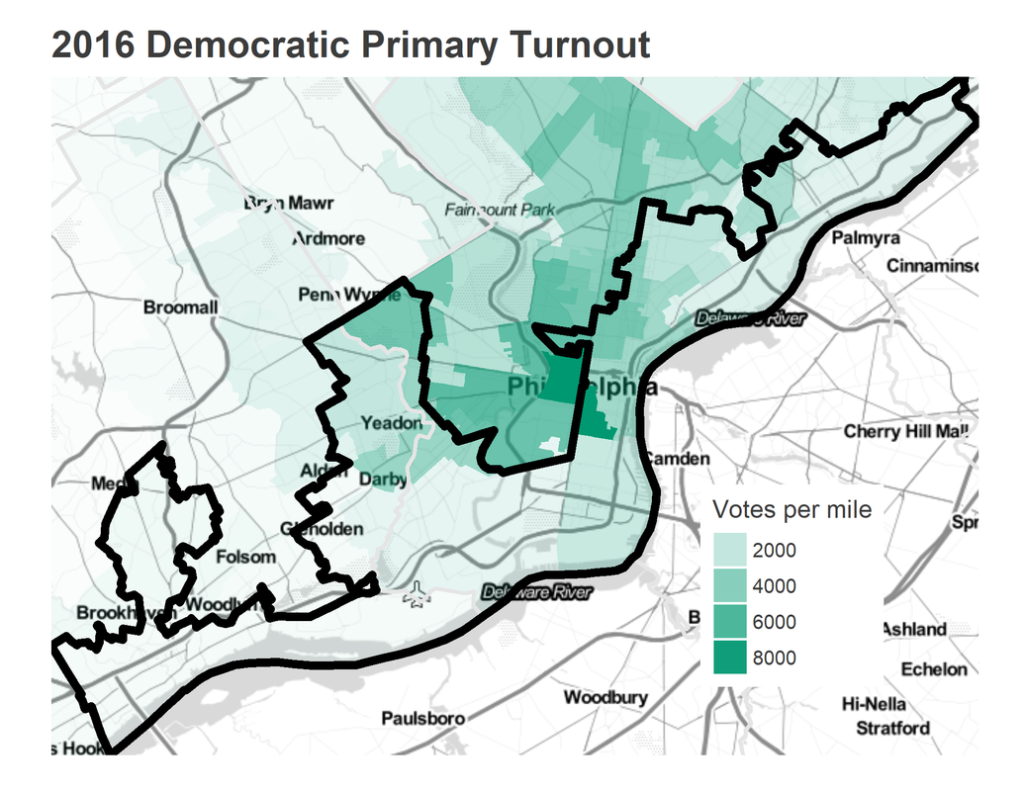
However, the neighborhoods that most strongly supported Clinton are also the neighborhoods that voted the most. A huge majority of the District’s votes come from Center South Philly, North Philly, and Southwest/West Philly. These overlap with some of Clinton’s strongest neighborhoods, especially in Southwest and West Philly.
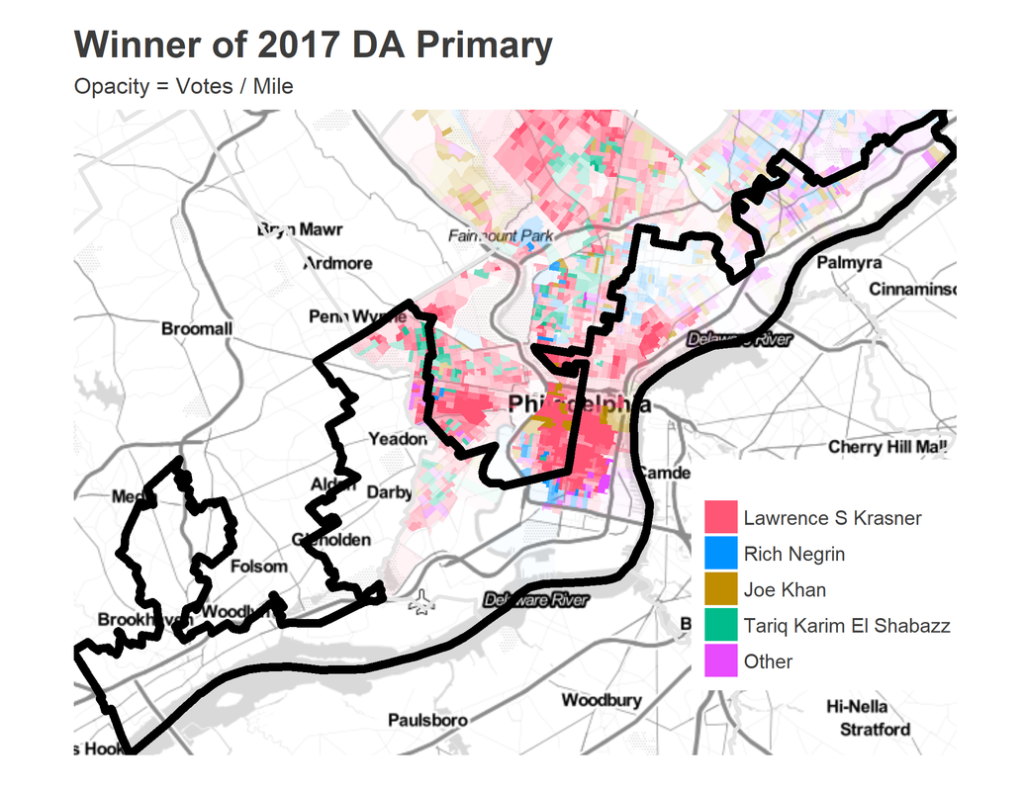
Since most of the votes come from the city anyway, it’s useful to look at the other competitive Democratic Primary we recently had: the 2017 Philadelphia race for District Attorney. This will exclude the suburban voters in District 1, but they are unlikely to carry the District. Those Center City and South Philly neighborhoods that supported Clinton came out for Larry Krasner one year later, as did the Sanders supporters in the River Wards.
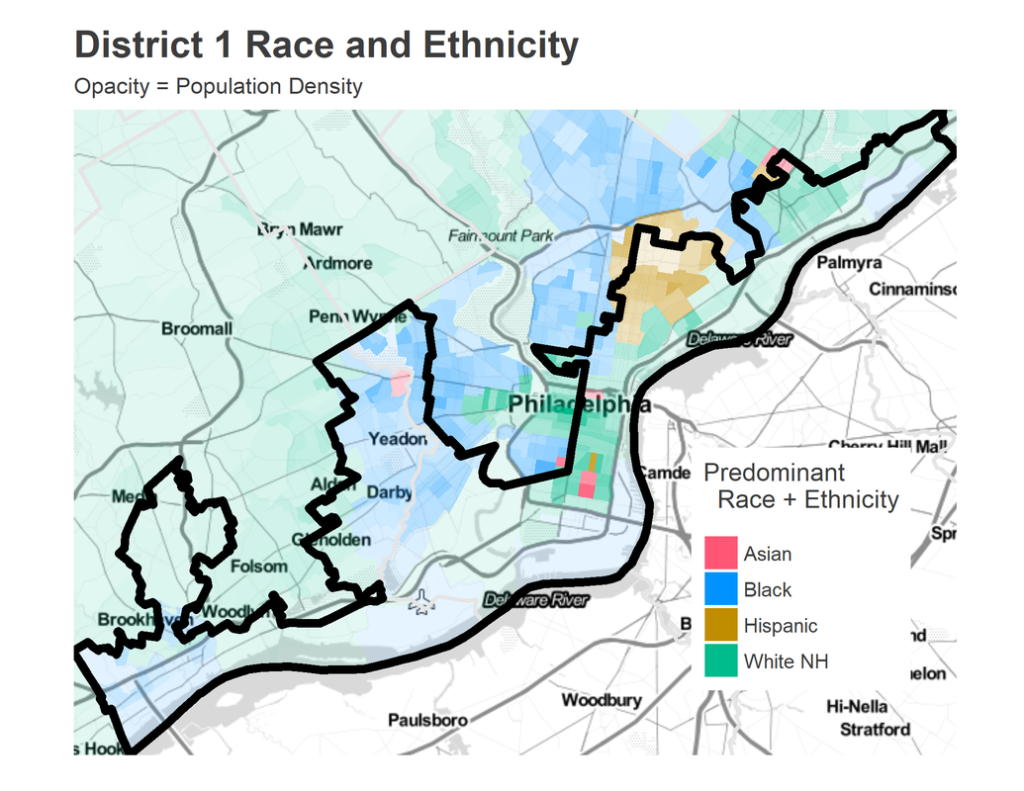
District 1 is racially diverse in a way little of America is. Of course, this top-line diversity does not actually represent neighborhood diversity, but is achieved by aggregating largely segregated neighborhoods. Below is a map of census tract race and ethnicity from the American Community Survey for 2012-16. Hispanic North Philly combines with White South Philly and River Wards and Black West Philly to create a patchwork representation. The map of race also lines up with the gerrymandered carve-outs of the district: District 1 hooks out to include predominately White Fairmount in Brady’s district, while it notably excludes predominately Black Point Breeze.
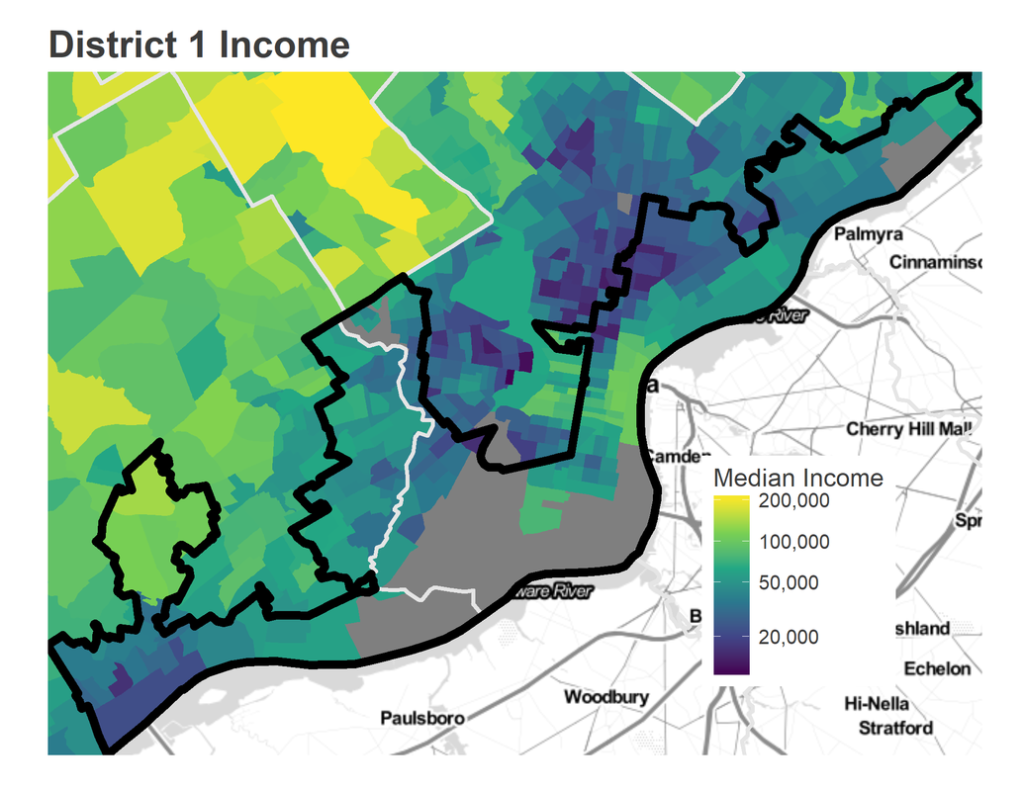
Brady’s district is predominately poor, typical of the City as a whole. Of course, while the population may be poor, the high-income tracts in Center City are also the places where most of the votes come from, so the average voter is wealthier than the district’s average resident.
What should we expect in May?
A ton of candidates are going to run for the House seat. Whoever wins the Democratic primary is going to win in November. Philadelphia voters constitute the vast majority of the district’s Primary turnout, and Philadelphians will decide the election. Given the neighborhoods that typically vote in primaries, the race will probably be decided by the White voters in Center City, South Philly and the River Wards along with the Black voters in West and Southwest Philly. Those voters split between Clinton and Sanders in 2016, but voted strongly for Krasner in 2017. If a candidate can manage to consolidate the left, especially in a likely high-candidate field, the race should be theirs.