November 6th are the midterm elections, the first national election since Donald Trump became president. Nationally, Democrats are expected to make gains. The discussion has largely centered on whether the “Blue Wave” will be large enough to help Democrats take control of the U.S. House or even the Senate.
Pennsylvania has important state and local races as well. Voters here will be choosing a Governor and Senator, in two elections where Democratic incumbents are well-positioned. How about the down-ballot races? Could the Pennsylvania House of Representatives be in play?
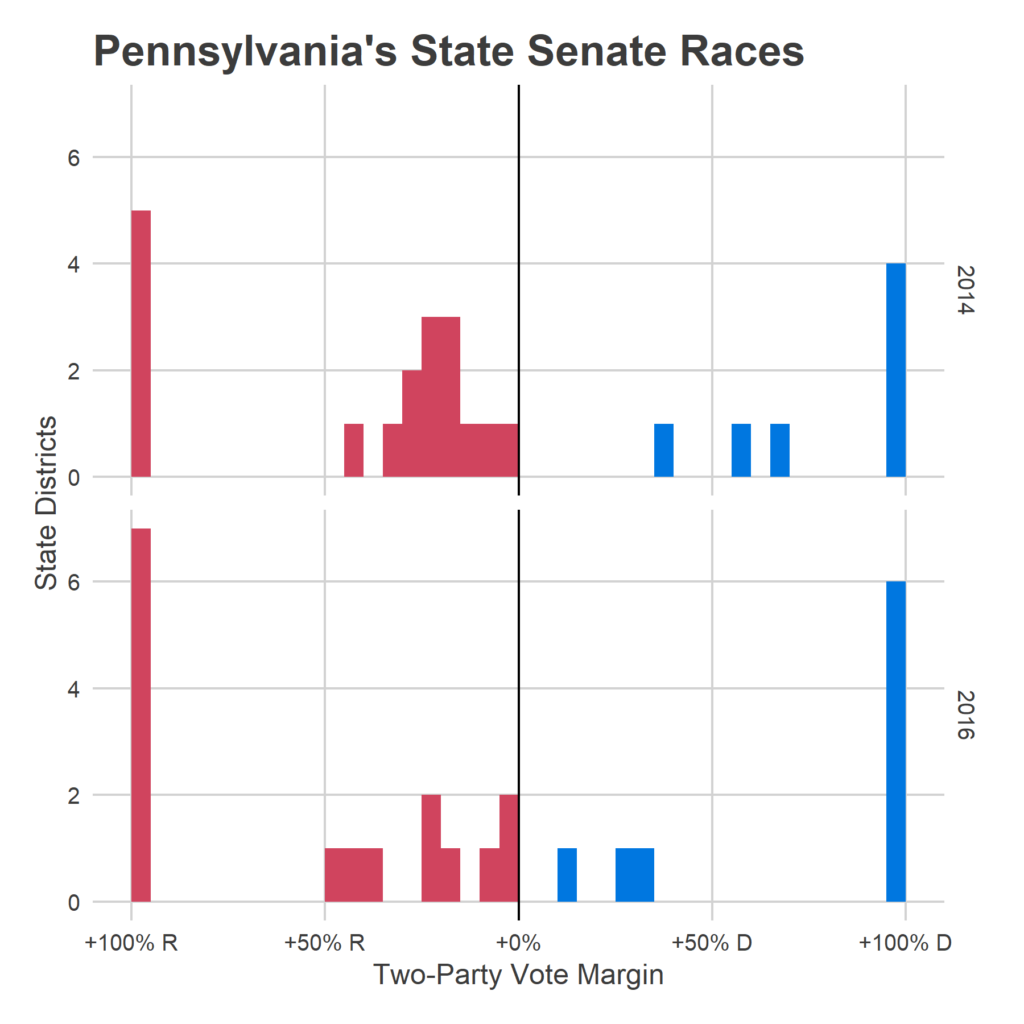
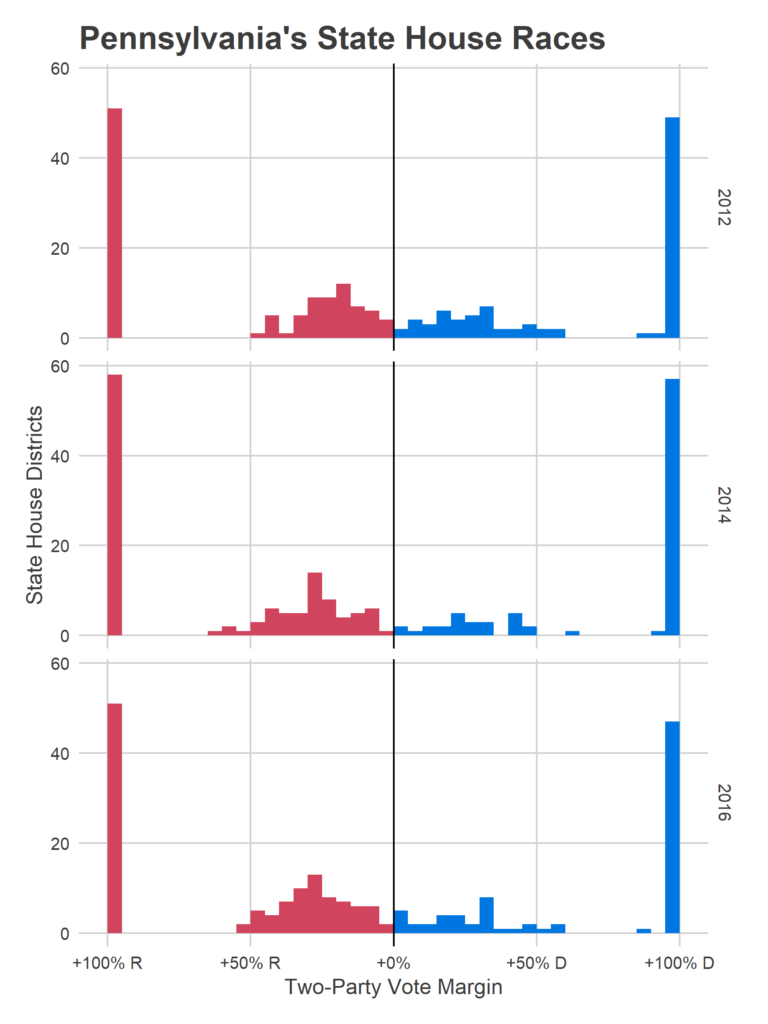
The Composition of the PA House
The Pennsylvania House has been solidly Republican since 2010, and has had a Republican majority for 20 out of the last 24 years. In 2016, 121 Republicans won versus 82 Democrats. Of those races, 51 were uncontested Republicans, and 47 uncontested Democrats.
In order to take back the house, Democrats need to pick up 20 seats. In a typical year, that would be impossible. But this year? Nationally, in Special Elections for congress, Democrats have seen an average
16 point increase over their baseline. This would imply that a race that went 58-42 to Republicans would be in play. If every state house district swung towards Democrats by 16 points from 2016, Democrats would pick up *17 seats*. And that’s not counting the races that Democrats failed to contest in 2016.
Philadelphia is vitally important in this picture. Some 13 of those Republican districts within 16 points are in Philadelphia or its four-county suburbs.
A surge of that size is probably not going to happen, but it shows what’s in play. These hyper-local races probably benefit from very strong incumbency, and it’s unclear how national signals will translate.
Pennsylvania has 19 districts with a Republican representative that was won by Hillary Clinton. Stunningly, every single one of them is in Philadelphia or its suburbs. And in two of those Democrats didn’t even field a candidate. If Donald Trump has nationalized the election, and energizes Democratic voters, Democrats could capitalize on this anti-Trump sentiment.
Plenty of people are trying to read the tea leaves in May’s Primary turnout. Could surges in Democratic Primary turnout presage victories in November? I look at turnout below. This discussion comes with a strong caveat: it’s unclear how well primary turnout translates to general election results, and that is even further complicated by the fact that turnout is driven by where races are competitive, and we had many (many) more competitive primaries than in 2014, the last midterm. That being said, below is a plot of primary turnout changes, from 2014 – 2018, broken down by 2016 election results.
District by District
Finally, let’s look at the raw data for the districts. To make this manageable, I’ve broken them into chunks based on whether the primaries were contested, party of the Representative, and 2016 Presidential results. Below, I present each district’s 2016 results (as the two-party vote, meaning excluding third parties and non-votes), and turnout in the 2014 and 2018 primaries.
First, the 39 districts that the Democrats didn’t contest in 2016 but now have a candidate, including two that Hillary won.
Next, the other 17 districts that voted for Republican representatives but also for Hillary in 2016. They’re all in Philadelphia and its suburbs.
Next, the 53 districts where a Republican representative won a contested race and Trump did too. Four of these were within 16 points of a Democratic victory in 2016.
Where were the districts that were extra Trumpy? Here are the 17 that voted for a Democratic Representative, but also for Trump (including 8 that the Republicans didn’t field a candidate).
Next, the 65 districts where Democrats won both the State House and Presidential race.
Finally, the twelve districts that Democrats didn’t contest in 2016 and still aren’t contesting in 2018.
Coming up next
What do we make of all this? Unfortunately, it’s unclear how this election will break. Are the districts that voted for a Republican Representative but Clinton in 2016 more likely to swing towards the Democrats, given the first two years of Trump’s presidency, or will they continue to support the incumbent, especially with Trump not on the ballot? Will the districts with primary surges show up? How important is the fact that Democrats have fielded candidates in 39 districts that went uncontested in 2016, and can that shift turnout there in ways that change the Governor’s race?
As the summer comes to a close, I’ll be looking at a few of these Philadelphia-area races, and trying to understand the landscape for November.