Pennsylvania House District 177

Welcome to the Sixty-Six Wards District Profiles! Democrats need to pick up 20 seats to tie up the PA House, and 19 districts currently held by Republicans voted for Clinton in 2016. All of them are in the Philadelphia region. Yesterday, I profiled Delco’s District 168, where DSA supported Kristin Seale is challenging Republican incumbent Christopher Quinn. But what if you wanted an interesting election, but insisted on taking the El? Well, we’ve got a fascinating race right in Port Richmond.

Today: Philadelphia’s PA House District 177

District 177 covers the River Wards above Lehigh, with an arm that stretches up to the Boulevard and Rhawn. The district has been represented by John Taylor since 1984, who headed Philadelphia’s Republican City Committee until recently stepping down. It largely contains the River Wards, while carving out a space for Taylor’s home, which lies in the Frankford arm of the boundaries.

With Taylor stepping down, this race doesn’t have an incumbent for the first time in 34 years. Democrat Joe Hohenstein will be facing off against Republican Patty Kozlowski. Hohenstein challenged Taylor in 2016 and lost 55-45, and won a crowded Democratic Primary  with a plurality of 37% of the vote. Kozlowski ran unopposed.

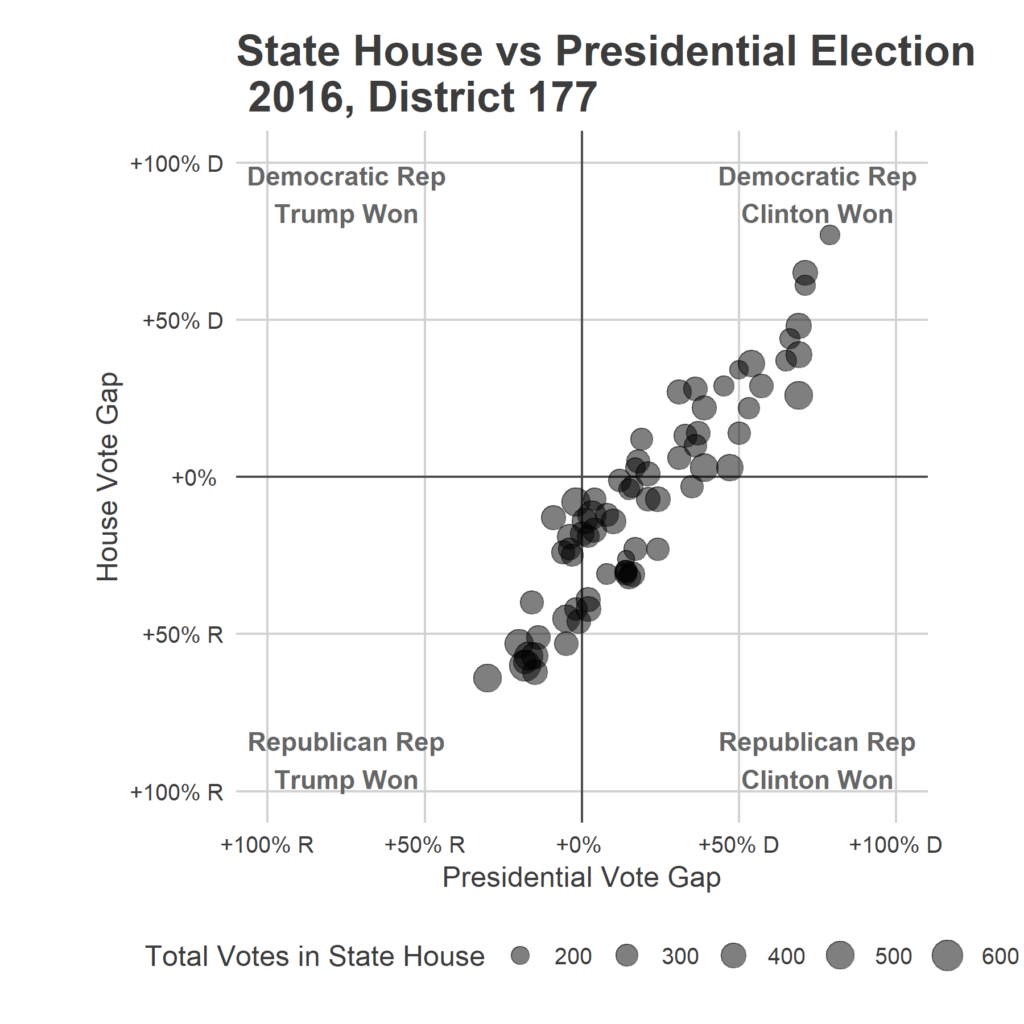
In 2016, Taylor beat Hohenstein by 10 points, even though Clinton beat Trump by 17 among the same voters. Taylor won 44 of the 71 divisions

[Interactive map here]

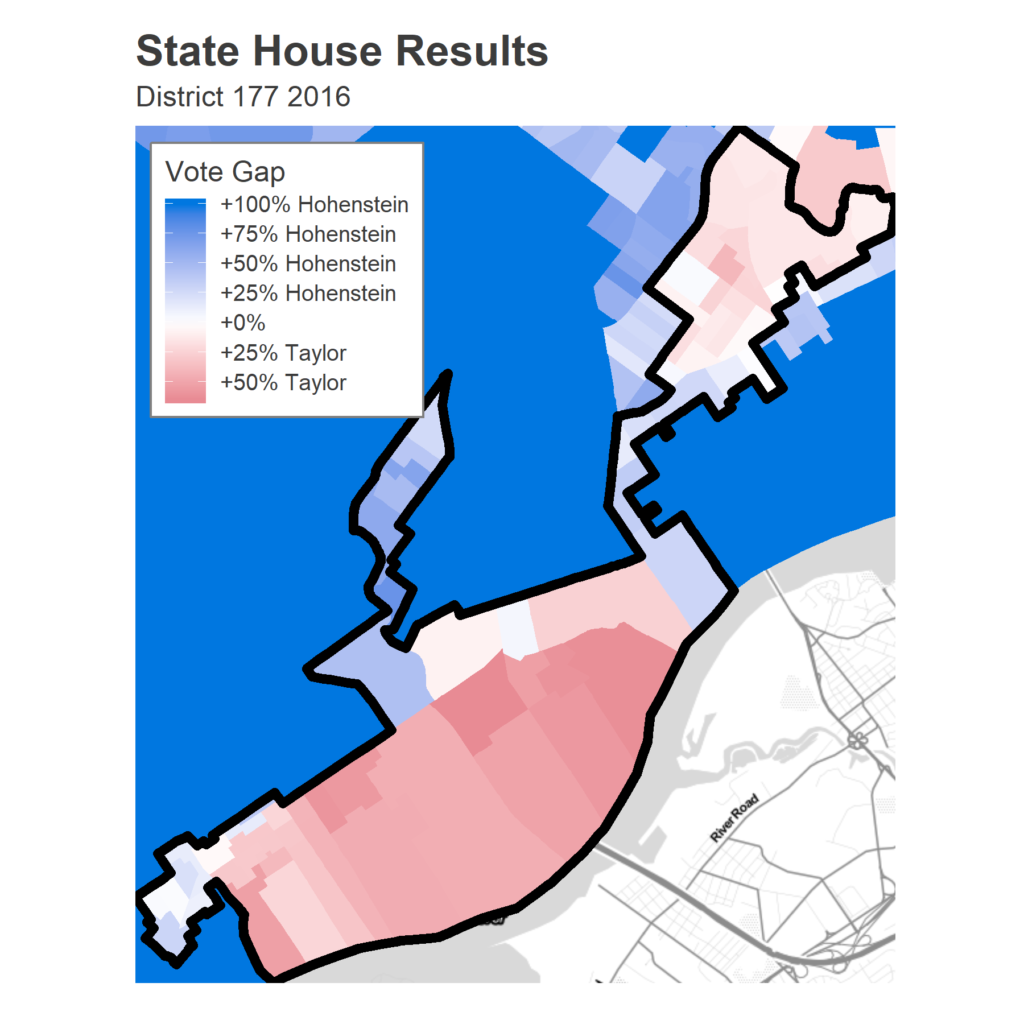
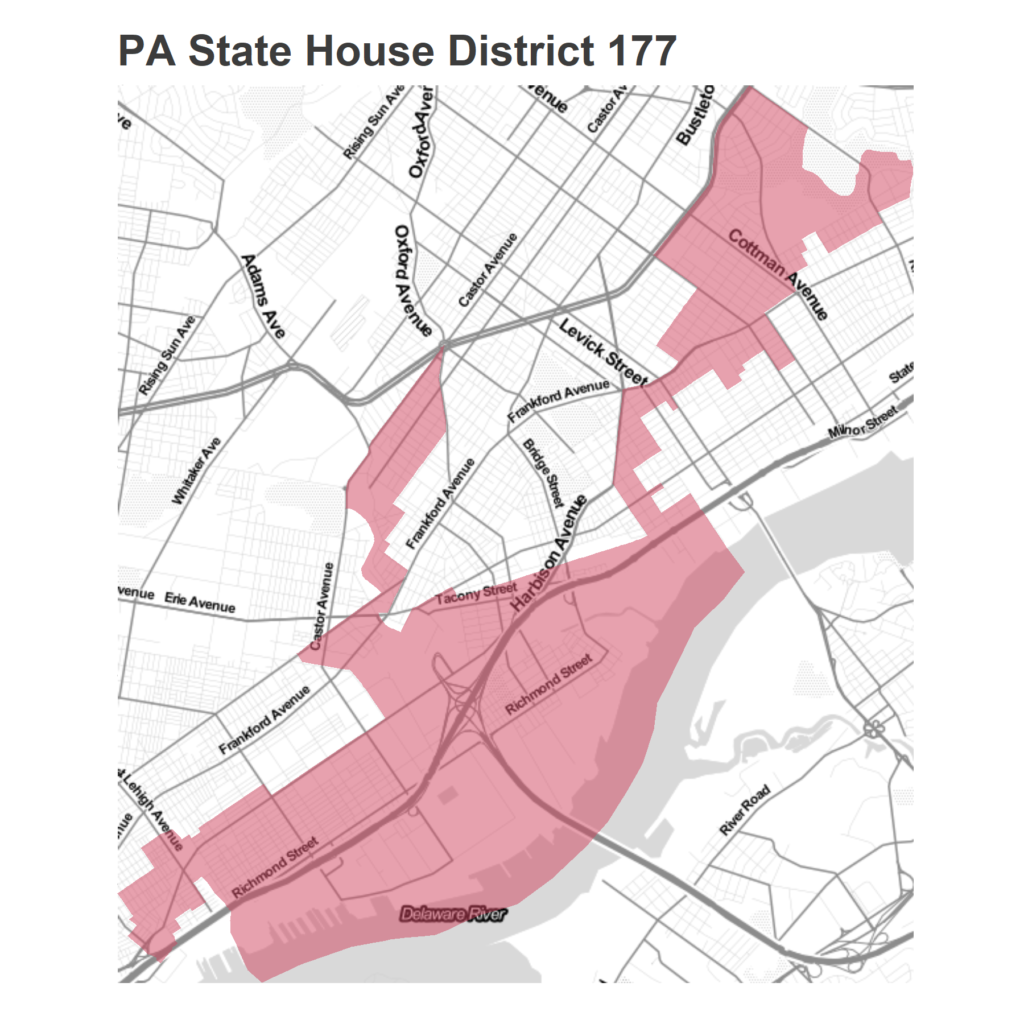
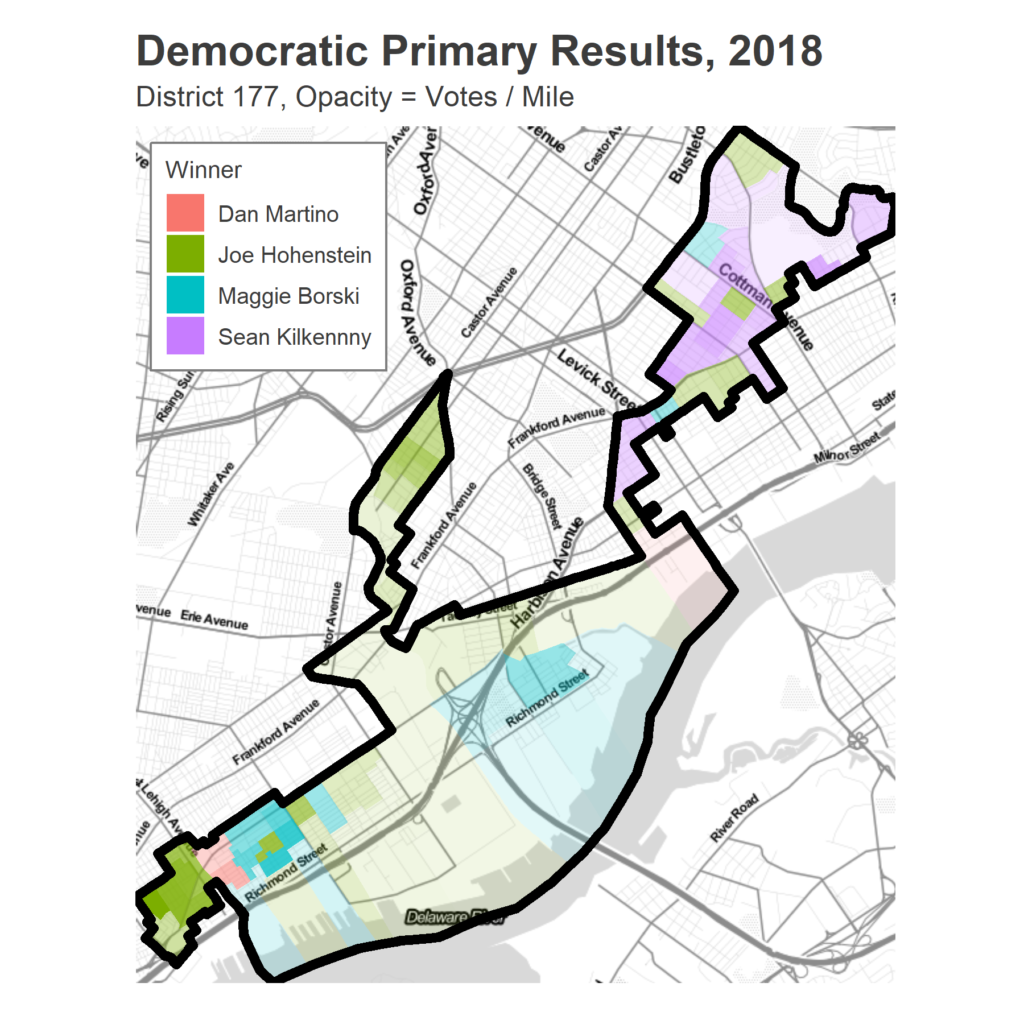
​The spatial map can be a little misleading, as those divisions along the river are largely commercial/industrial, and have low population densities. A map of votes per mile shows the relative strengths of the districts.

[Interactive map here]

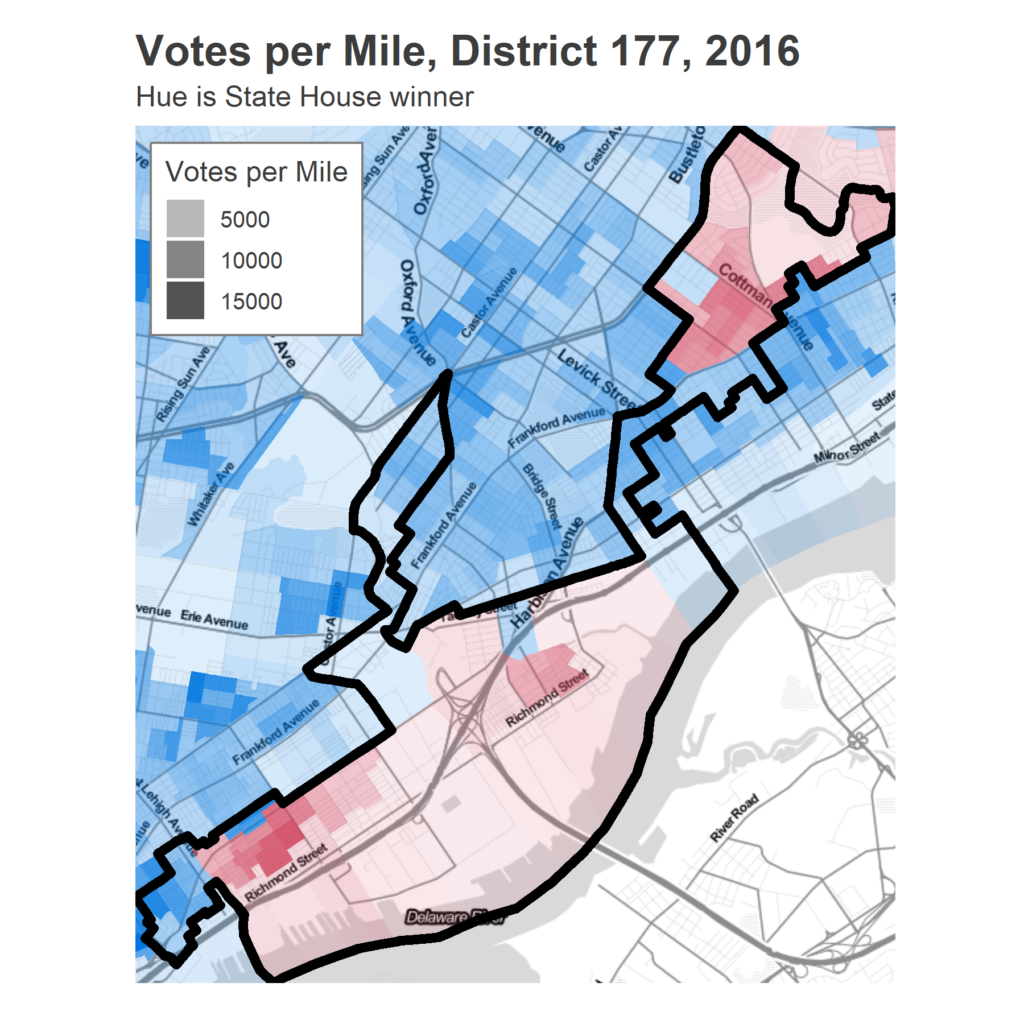
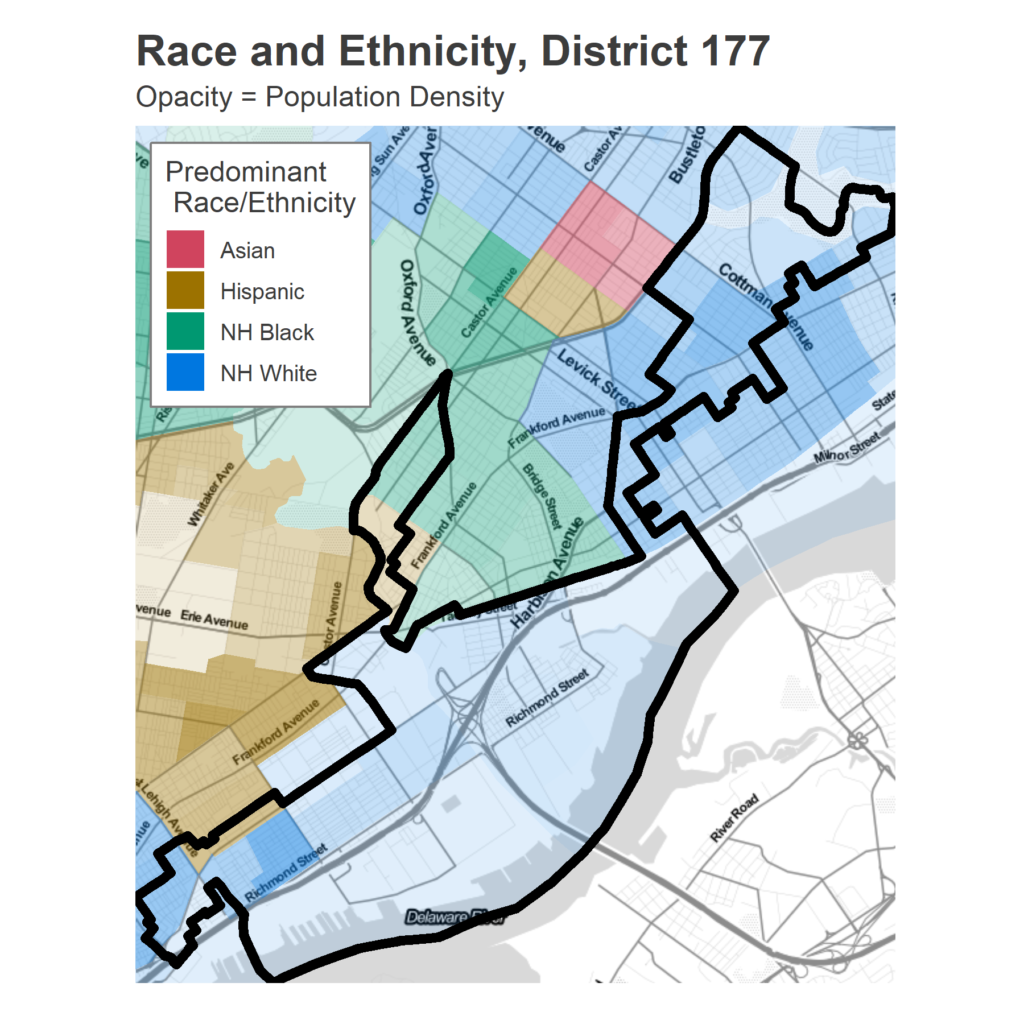
The district also manages to gerrymander out significant chunks of non-White Frankford. The one nub that ventures into predominantly Hispanic and Black neighborhoods along Castor Ave are also the divisions that voted the strongest for Hohenstein two years ago.

[Interactive map here]

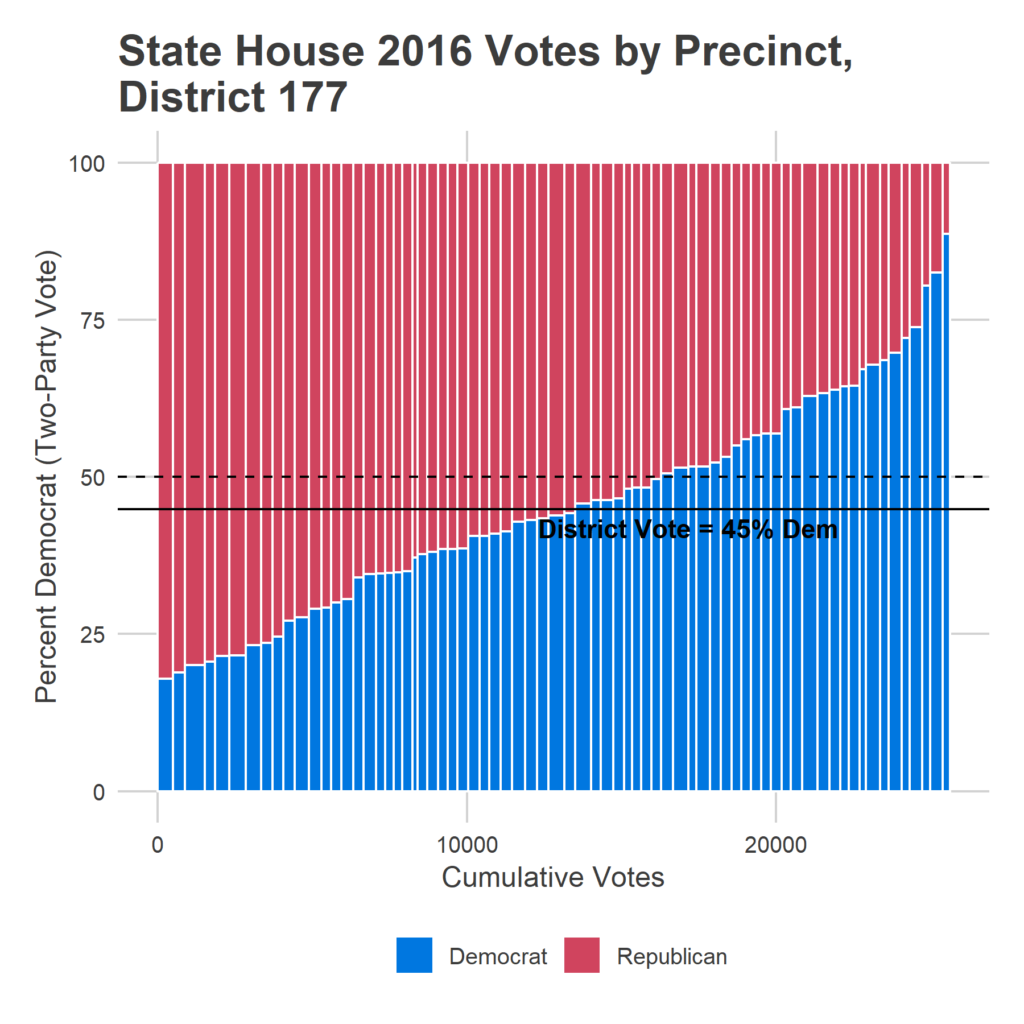
So how close is the race overall? The plot below lines up divisions by their 2016 percent Democrat, with widths denoting a division’s total votes. A ton of divisions sat between 40-50% Democrat in 2016, which would mean FiveThirtyEight’s 16 point swing towards the Democrats (an 8 percent increase in the vote) would easily put them over.

[Interactive plot here]

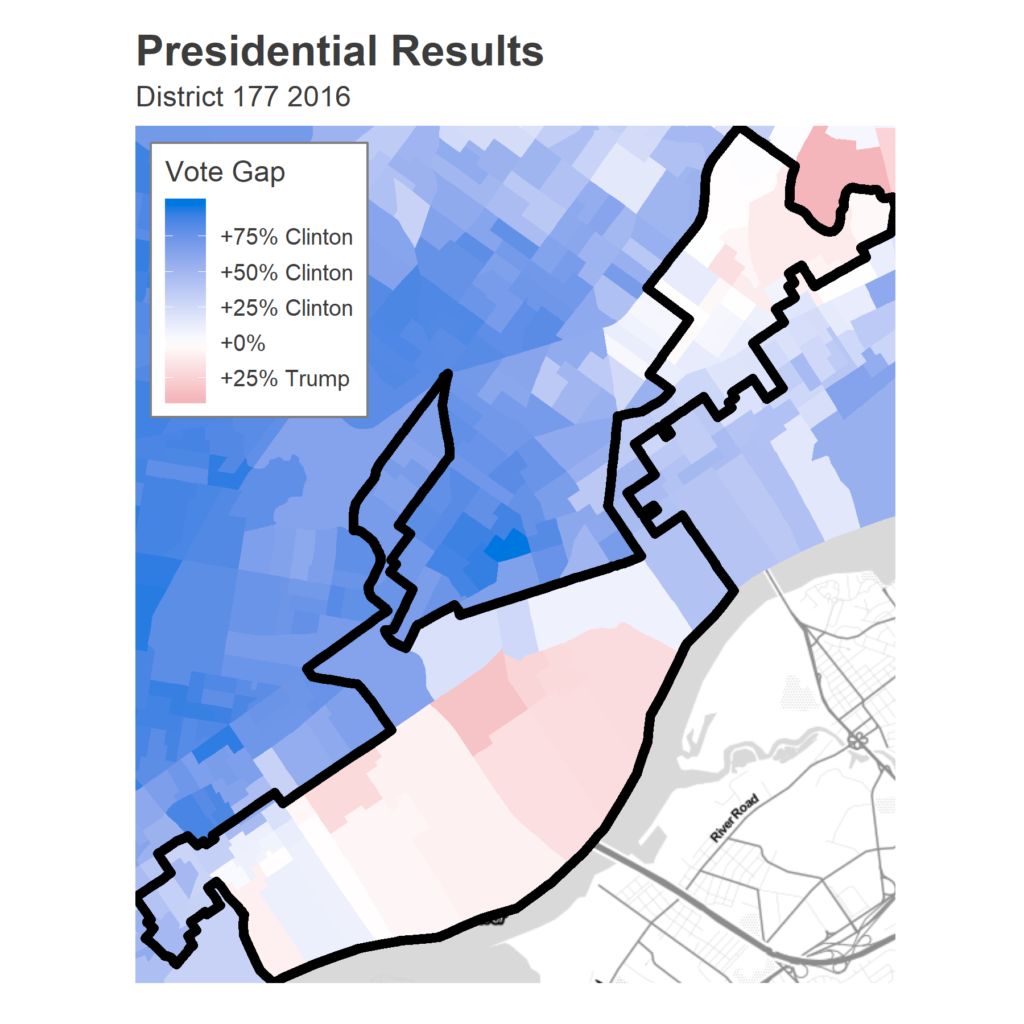
Presidential Results
There are two huge good signs for Democrats: the retirement of Taylor, and how well Clinton did in 2016. She won by 17 points, even as Taylor carried the district. Every single division voted more strongly for Taylor than for Trump in 2016, indicating either favor for the incumbent or anti-Trumpism.

[Interactive plot here]

Turnout
A huge question in this district is going to be turnout. The district is extremely diverse, racially and politically, and the relative mobilization of precincts could determine who wins.

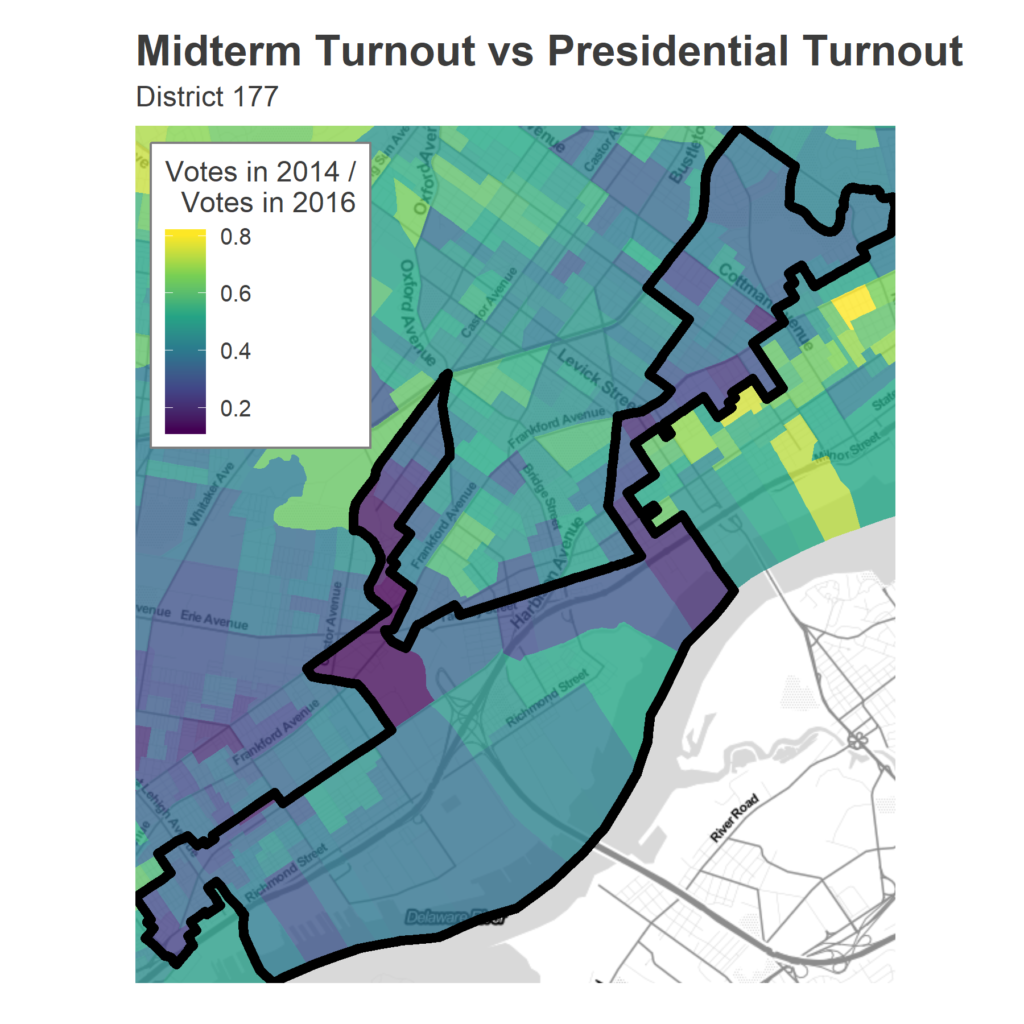
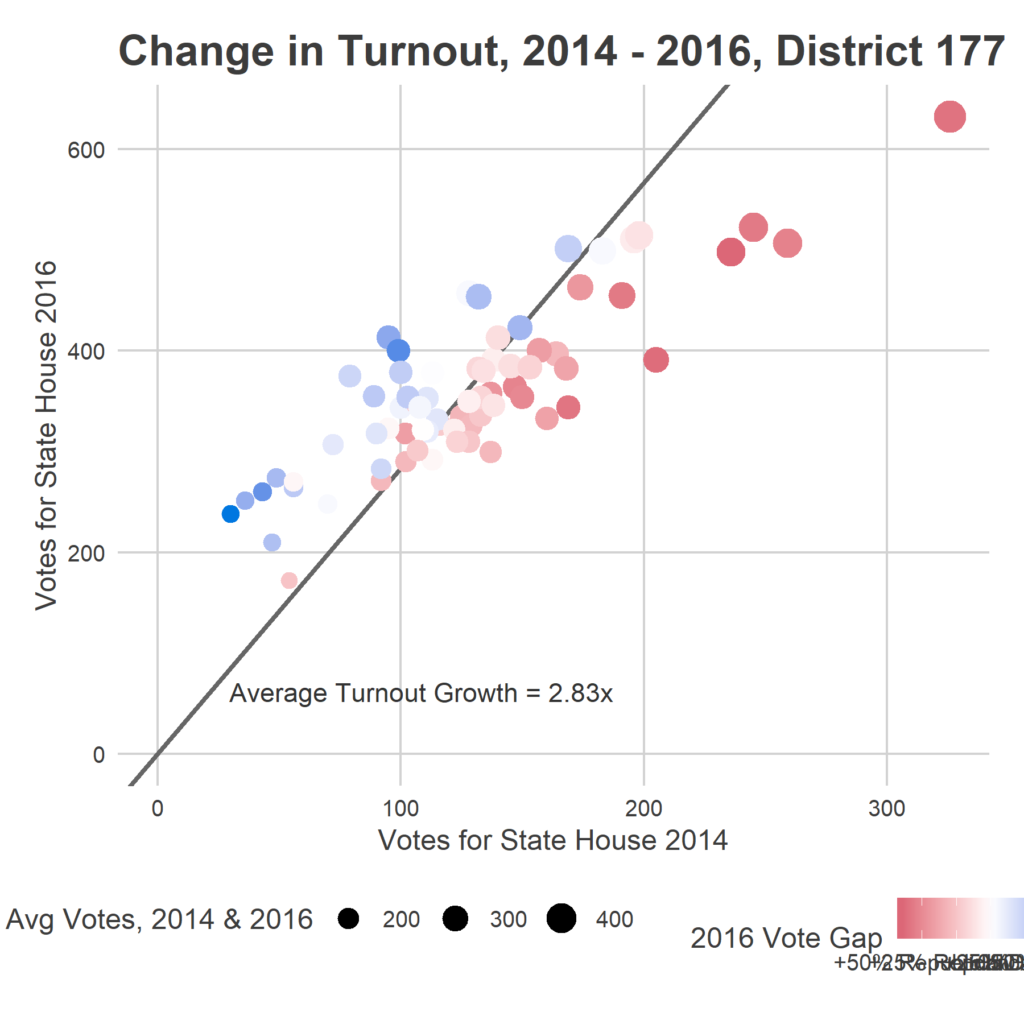
Turnout in the 2014 midterm was extremely weighted towards the Republican divisions. While the district as a whole saw 2.8 times as many voters in 2016 as in 2014, many Democratic divisions say *four times* the turnout. The heavily Republican divisions, because they turn out so strongly in midterms, had less relative growth.

There’s one more data-point, and it’s a doozy. Democratic turnout in May’s primary was 4,533 voters. Only 1,541 Republicans voted in May, but Kozlowski was running unopposed.

Four years ago, only 13,237 people voted in the *general*, for the Governor’s race. It’s hard to figure out exactly what this means, since in 2014 this district didn’t even have a Democratic Primary, though it *did* have a Governor’s primary, with 2018 didn’t.

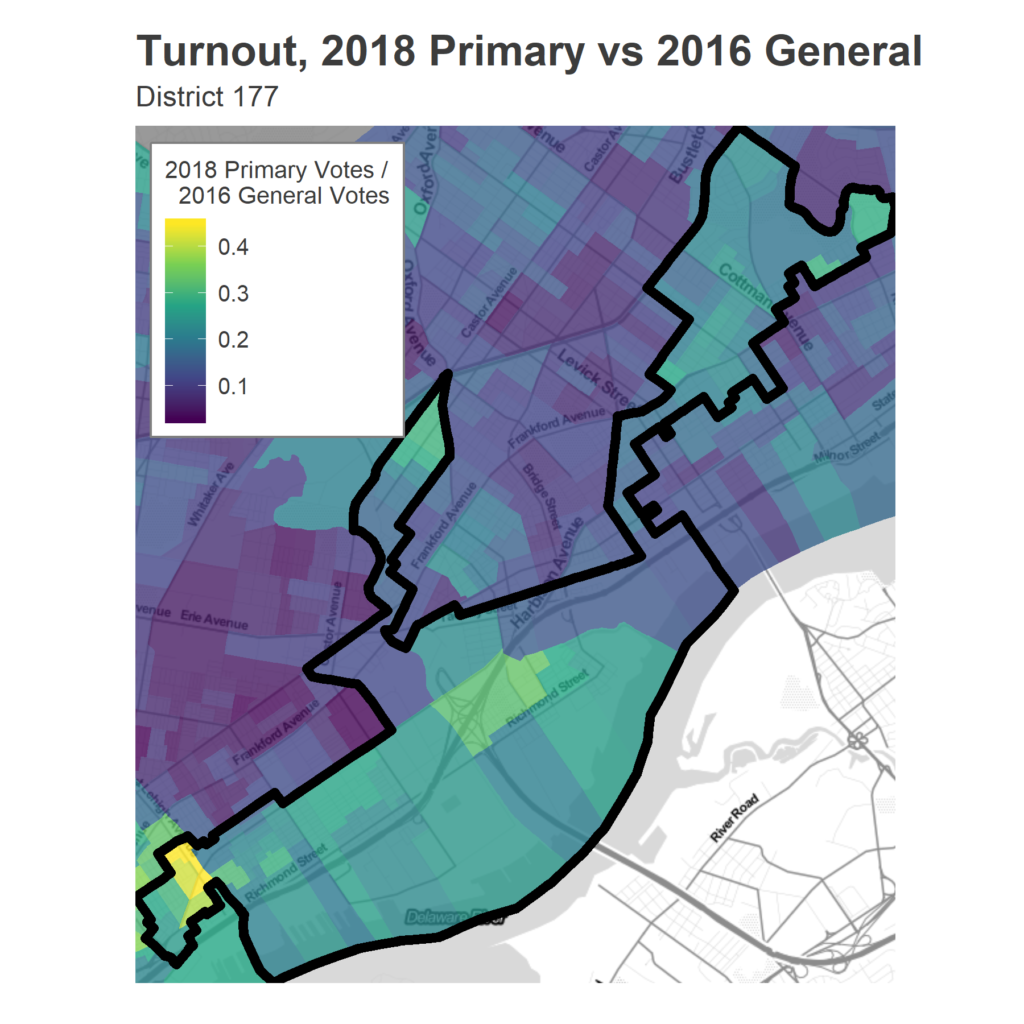
The map of Democratic turnout, though, is revelatory. The map belows shows votes in the May primary as a fraction of total votes in 2016. This gives a good measure of relative mobilization, assuming that the 2016 election represents a peak attainable turnout.

The very bottom of the district, along Lehigh Ave, went bonkers in the Primary, with over 40% of 2016 turnout in some divisions. Those are also where Hohenstein cleaned up:
Sources:
Election data from www.philadelphiavotes.com
Population data from the 2016 American Community Survey 5-year estimates.
Boundaries and GIS data from www.opendataphilly.org
Base maps provided by maps.stamen.com/

Updates: I’ve edited this article to reflect the fact that Representative Taylor lives in the Frankford arm of the district, explaining at least that part of its odd shape.

Pennsylvania House District 168

Welcome to the Sixty-Six Wards District Profiles! I’ll be walking through the most interesting races occuring in Philadelphia and the burbs (mostly the burbs), starting with the PA House. Democrats need to pick up 20 seats to tie up the PA House. Nineteen districts currently held by Republicans nonetheless voted for Clinton; all of them are in the Philadelphia region.

Today: Delaware County’s PA House District 168.

District 168 covers the Northeast of Delco, including parts of Media. It is represented by Christopher Quinn, a Republican who was first elected in 2016. Before that, it was represented by longtime Republican rep Thomas Killion, and has never been represented by a Democrat.

In 2016, Quinn beat Democratic challenger Diane Levy by 12 points. Clinton beat Trump by 7 among the same voters. In Special Elections since, FiveThirtyEight has calculated a 16 point swing towards Democrats nationally, which would provide a 4 point Democratic victory if it held here. Of course, Quinn won significantly in 2016 in this anti-Trump district, even in the year that Trump was on the ballot.

This year, Quinn is being challenged by Democrat Kristin Seale. She won a competitive primary by only 100 votes, and would be the first woman and first Democrat to hold the seat. She is running as a strong progressive, endorsed by the DSA and several union groups.

Election History

In 2016, the Republican Quinn won by 12 points, and won in 33 of the district’s 40 precincts.

​The precincts that voted for Democrat Levy were all centered around Media, the district’s “urban” core.
​Those precincts are both the densest residentially—the represented 19% of the votes—and the most racially diverse, though no precinct is less than 74% White.
Lining up the districts by results from the 2016 in the State House race shows how dramatically Republican it was.
For Kristin Seale to win, she would need to swing those marginal precincts towards her (raise the bars) or *drastically* increase turnout in the Democratic precincts (widen the Democratic bars). The plot makes it pretty clear that just increasing turnout in Media probably won’t cut it.

The map of the 2016 Presidential race looks completely different from the State House race of the same election, with 23 of the precincts voting for Clinton:

​In fact, every single precinct voted more for Quinn than they did for Trump.
Finally, how should we expect turnout to compare to 2016? Some 38,000 votes were cast in the State House race in 2016, compared to 16,000 in 2014. The Democratic precincts saw much larger jumps in turnout between elections, mirroring a longstanding rule that midterm election turnout favors Republicans. If a Blue Wave means that Democratic turnout is more like a Presidential year, the election could be hers.
​There are a number of open questions that are unanswerable. The biggest is: What should we make of a district that simultaneously elected a Republican State Rep and swung hard towards Clinton, both to landslide victories in the same election? Will these Delco voters stick with their favored incumbent, especially without Trump on the ballot? Or has the intervening two years of a Trump presidency turned these voters, who already disliked Trump, against Republicans all the way down the ballot? We’ll see in November.

Sources:
Election data from the Open Elections Project
Population data from the 2016 American Community Survey 5-year estimates.
Boundaries and GIS data from election-geodata
Base maps provided by maps.stamen.com/