The Composition of the PA Senate
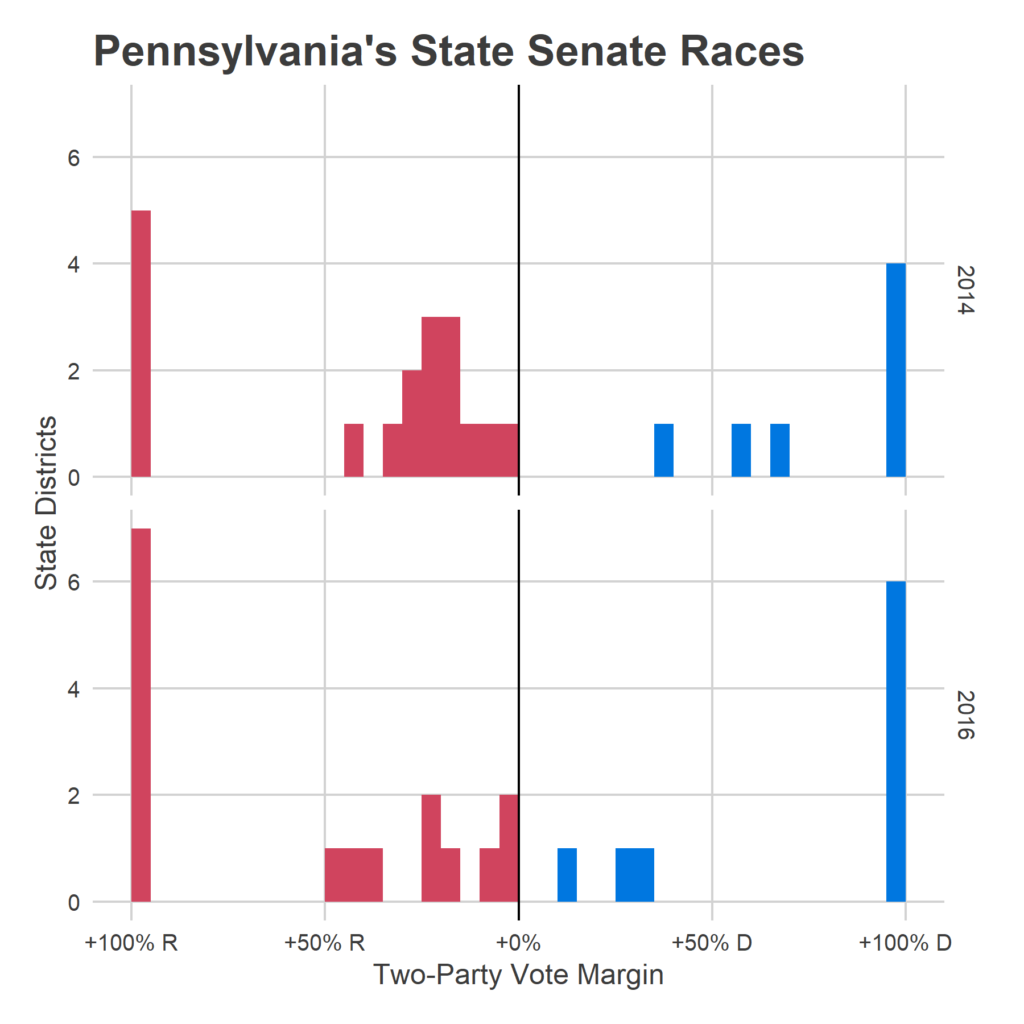
The Senate has 50 members, who serve four-year terms. That means 25 are up for election in November. Currently, the Senate is lopsided: 34 Republicans versus 16 Democrats (in a State that was evenly split in the 2016 election). Among those elected in 2014 and up for reelection, 18 are Republicans, and 7 Democrats. Nine of those 2014 races were uncontested, including four Democrats and five Republicans.

Alternatively, use the 2016 Presidential Election as a guide: there are seven districts that voted for Republican Senators in 2014 but for Hillary Clinton in 2016, and one that voted for a Democratic Senator but for Donald Trump. Five of those districts are in Philadelphia’s suburbs.
Below is a breakdown of the districts with 2018 elections. I’ve broken them into chunks based on the party of the current Senator, and whether they voted for Clinton or for Trump. Below, I present each district’s 2016 results (as the two-party vote, meaning excluding third parties and non-votes), and turnout in the 2014 and 2018 primaries.
First, the seven districts with Republican senators defending seats that voted for Clinton.
Democrats would need to gain 9 seats to even up the State Senate. To pull that off, they would have to win all but one of the ten districts that either (a) voted for Clinton or (b) were within a 16 point gap in 2014. That’s a long shot. But even a less lopsided Senate could have a big impact on state politics, and gains now could set up a real Senate challenge when the other 25 senators are up for election in 2020.