First, let’s look at what happened on November 7th.
Philadelphia turnout *surged*. Some 198,905 ballots were cast in the race for District Attorney, compared to 110,351 in 2013. That’s an 80% increase in voters, after a 156% increase in May’s Primary. Pessimists will point out that 199 thousand voters is still only 20% of Philadelphia’s registered voters, but movement like this is impressive. (As of now, 2017 turnout only includes machine records, so this number could increase by another two to five thousand).
This year’s election was the District Attorney race out of the four-year cycle, which historically has the lowest turnout. Presidential elections have the highest turnout, predictably, followed by Governor, Mayor, and then D.A.
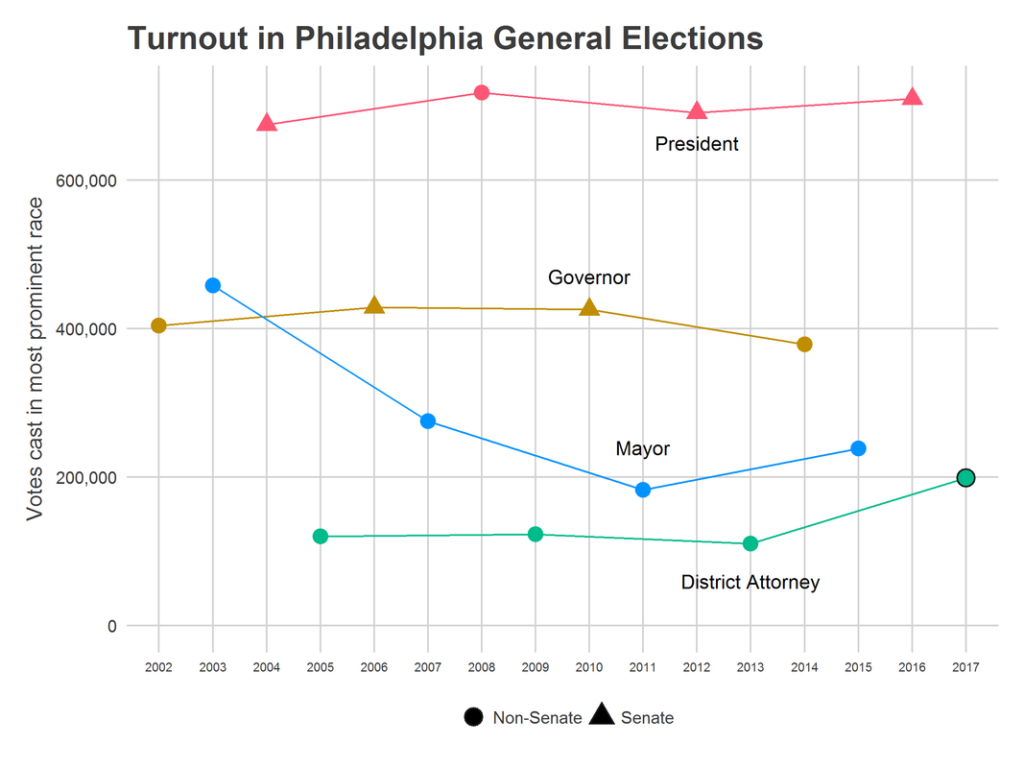
Compare the Generals to the Primaries:
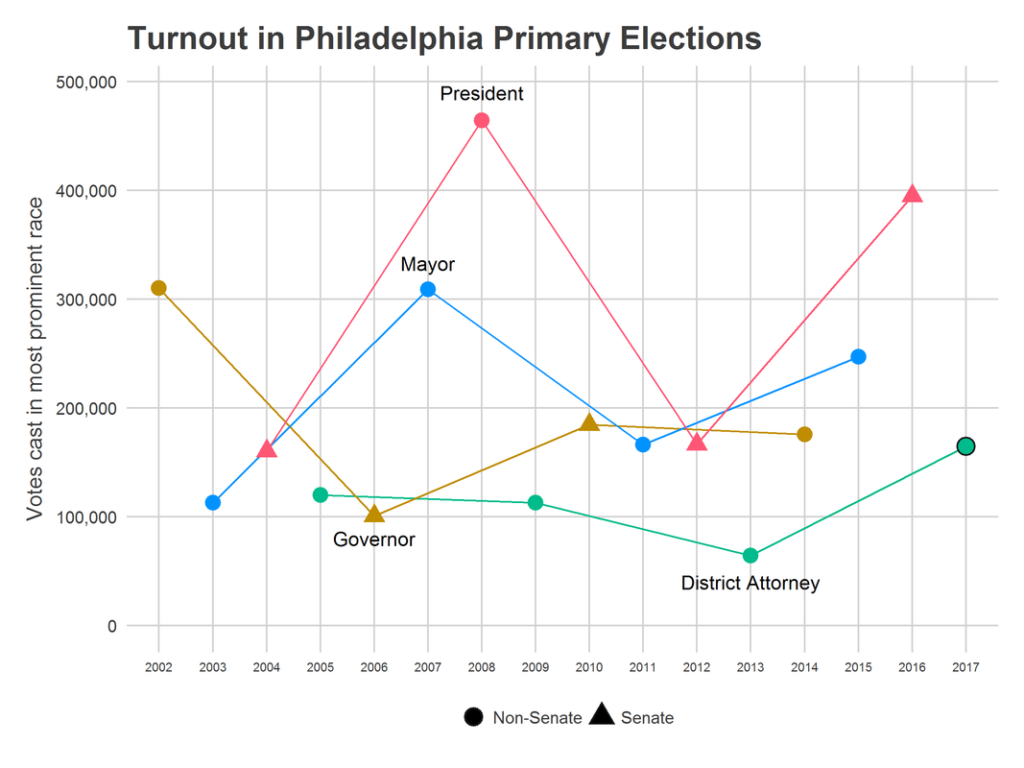
This year saw a competitive D.A.’s primary and a general election that was closer than usual. Still, 2017’s turnout, in both plots, represents larger swings than any D.A. swings we’ve recently seen. Something is fundamentally different.
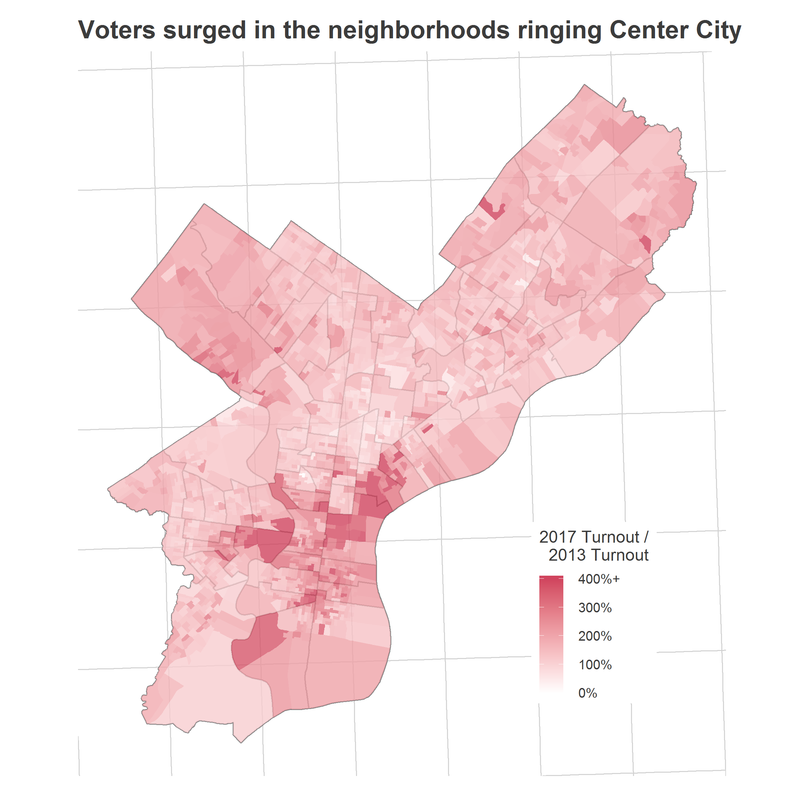
The ring around Center City is driving the turnout boom
Voting across the city was up 80% from 2013. But many of the divisions surrounding Center City saw turnout *triple*. University City, Northern Liberties, Fishtown, and Point Breeze/Girard Estates are marked hot spots on the map. [An interactive version of all maps is available at the bottom of this post.]
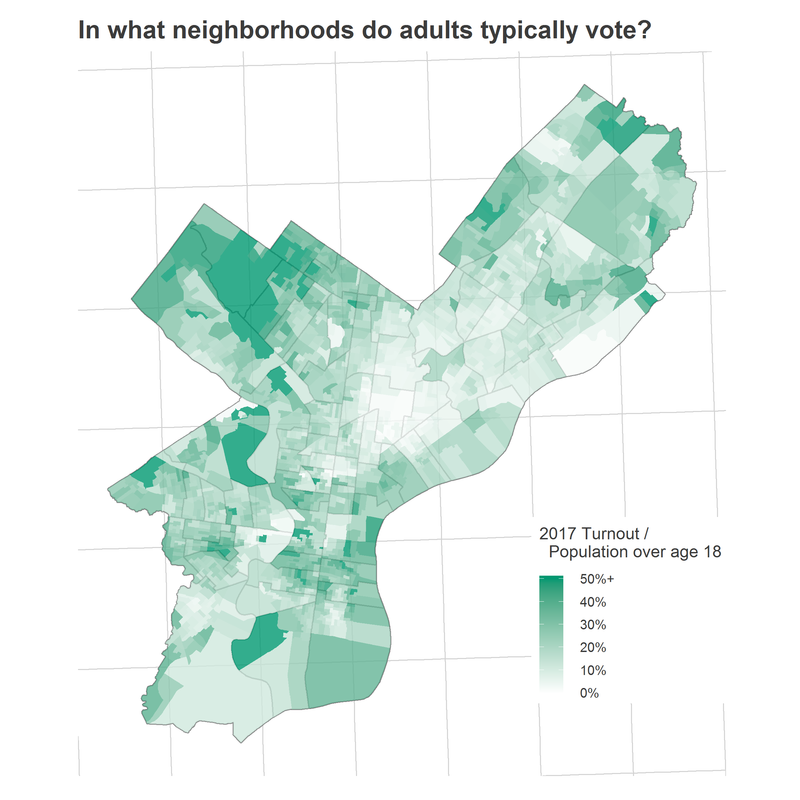
What about the other wealthy neighborhoods? They’ve been voting all along, and just didn’t have much room to grow. Center City and Chestnut Hill already had the highest turnout rates in the city. Below is a map of the percentage of all residents over age 18 that voted (I prefer this to registered voters, because it bakes in inequities in registration and eligibility, and skirts the challenges of keeping rolls up to date).
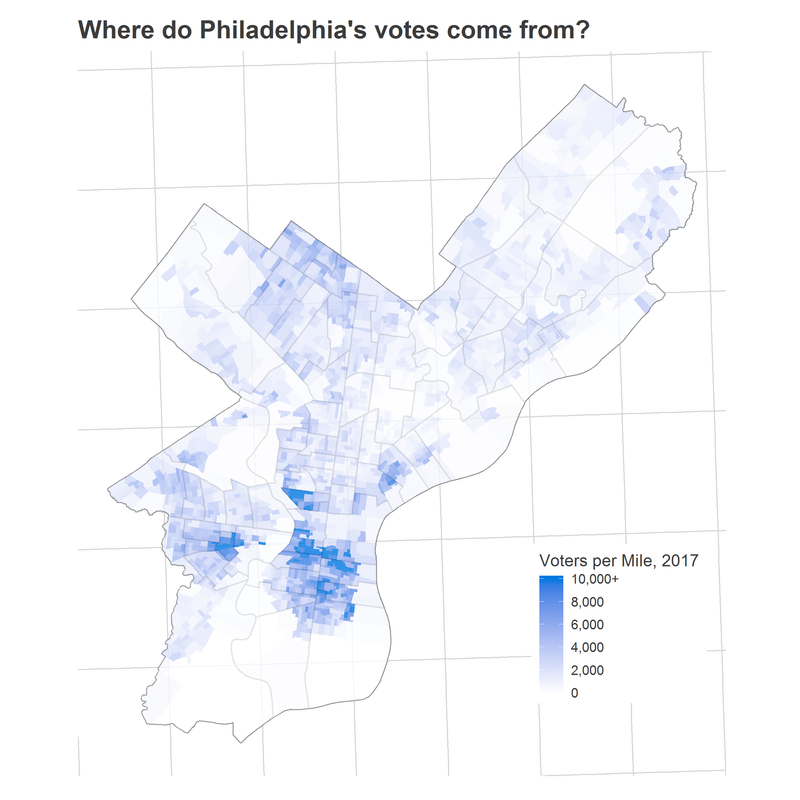
A final way to map electoral turnout is by voters per mile. This represents where the voters actually are, down-scaling neighborhoods that have high turnout rates but not many residents.
Where we go from here
Turnout surged this year, and in a way that appears to be fundamentally different from anything we’ve recently seen. In upcoming posts, I’ll continue to explore this fascinating time:
– How does Philadelphia’s turnout intersect with race and class, and what does this mean for our governance?
– Could this surge be permanent?
– In what other ways is the ring around Center City, with booming votes, politically different?
– What turnout does Philadelphia need to carry the state in 2018?
Questions? Comments? Ideas? Comment below!
Appendix: Maps!