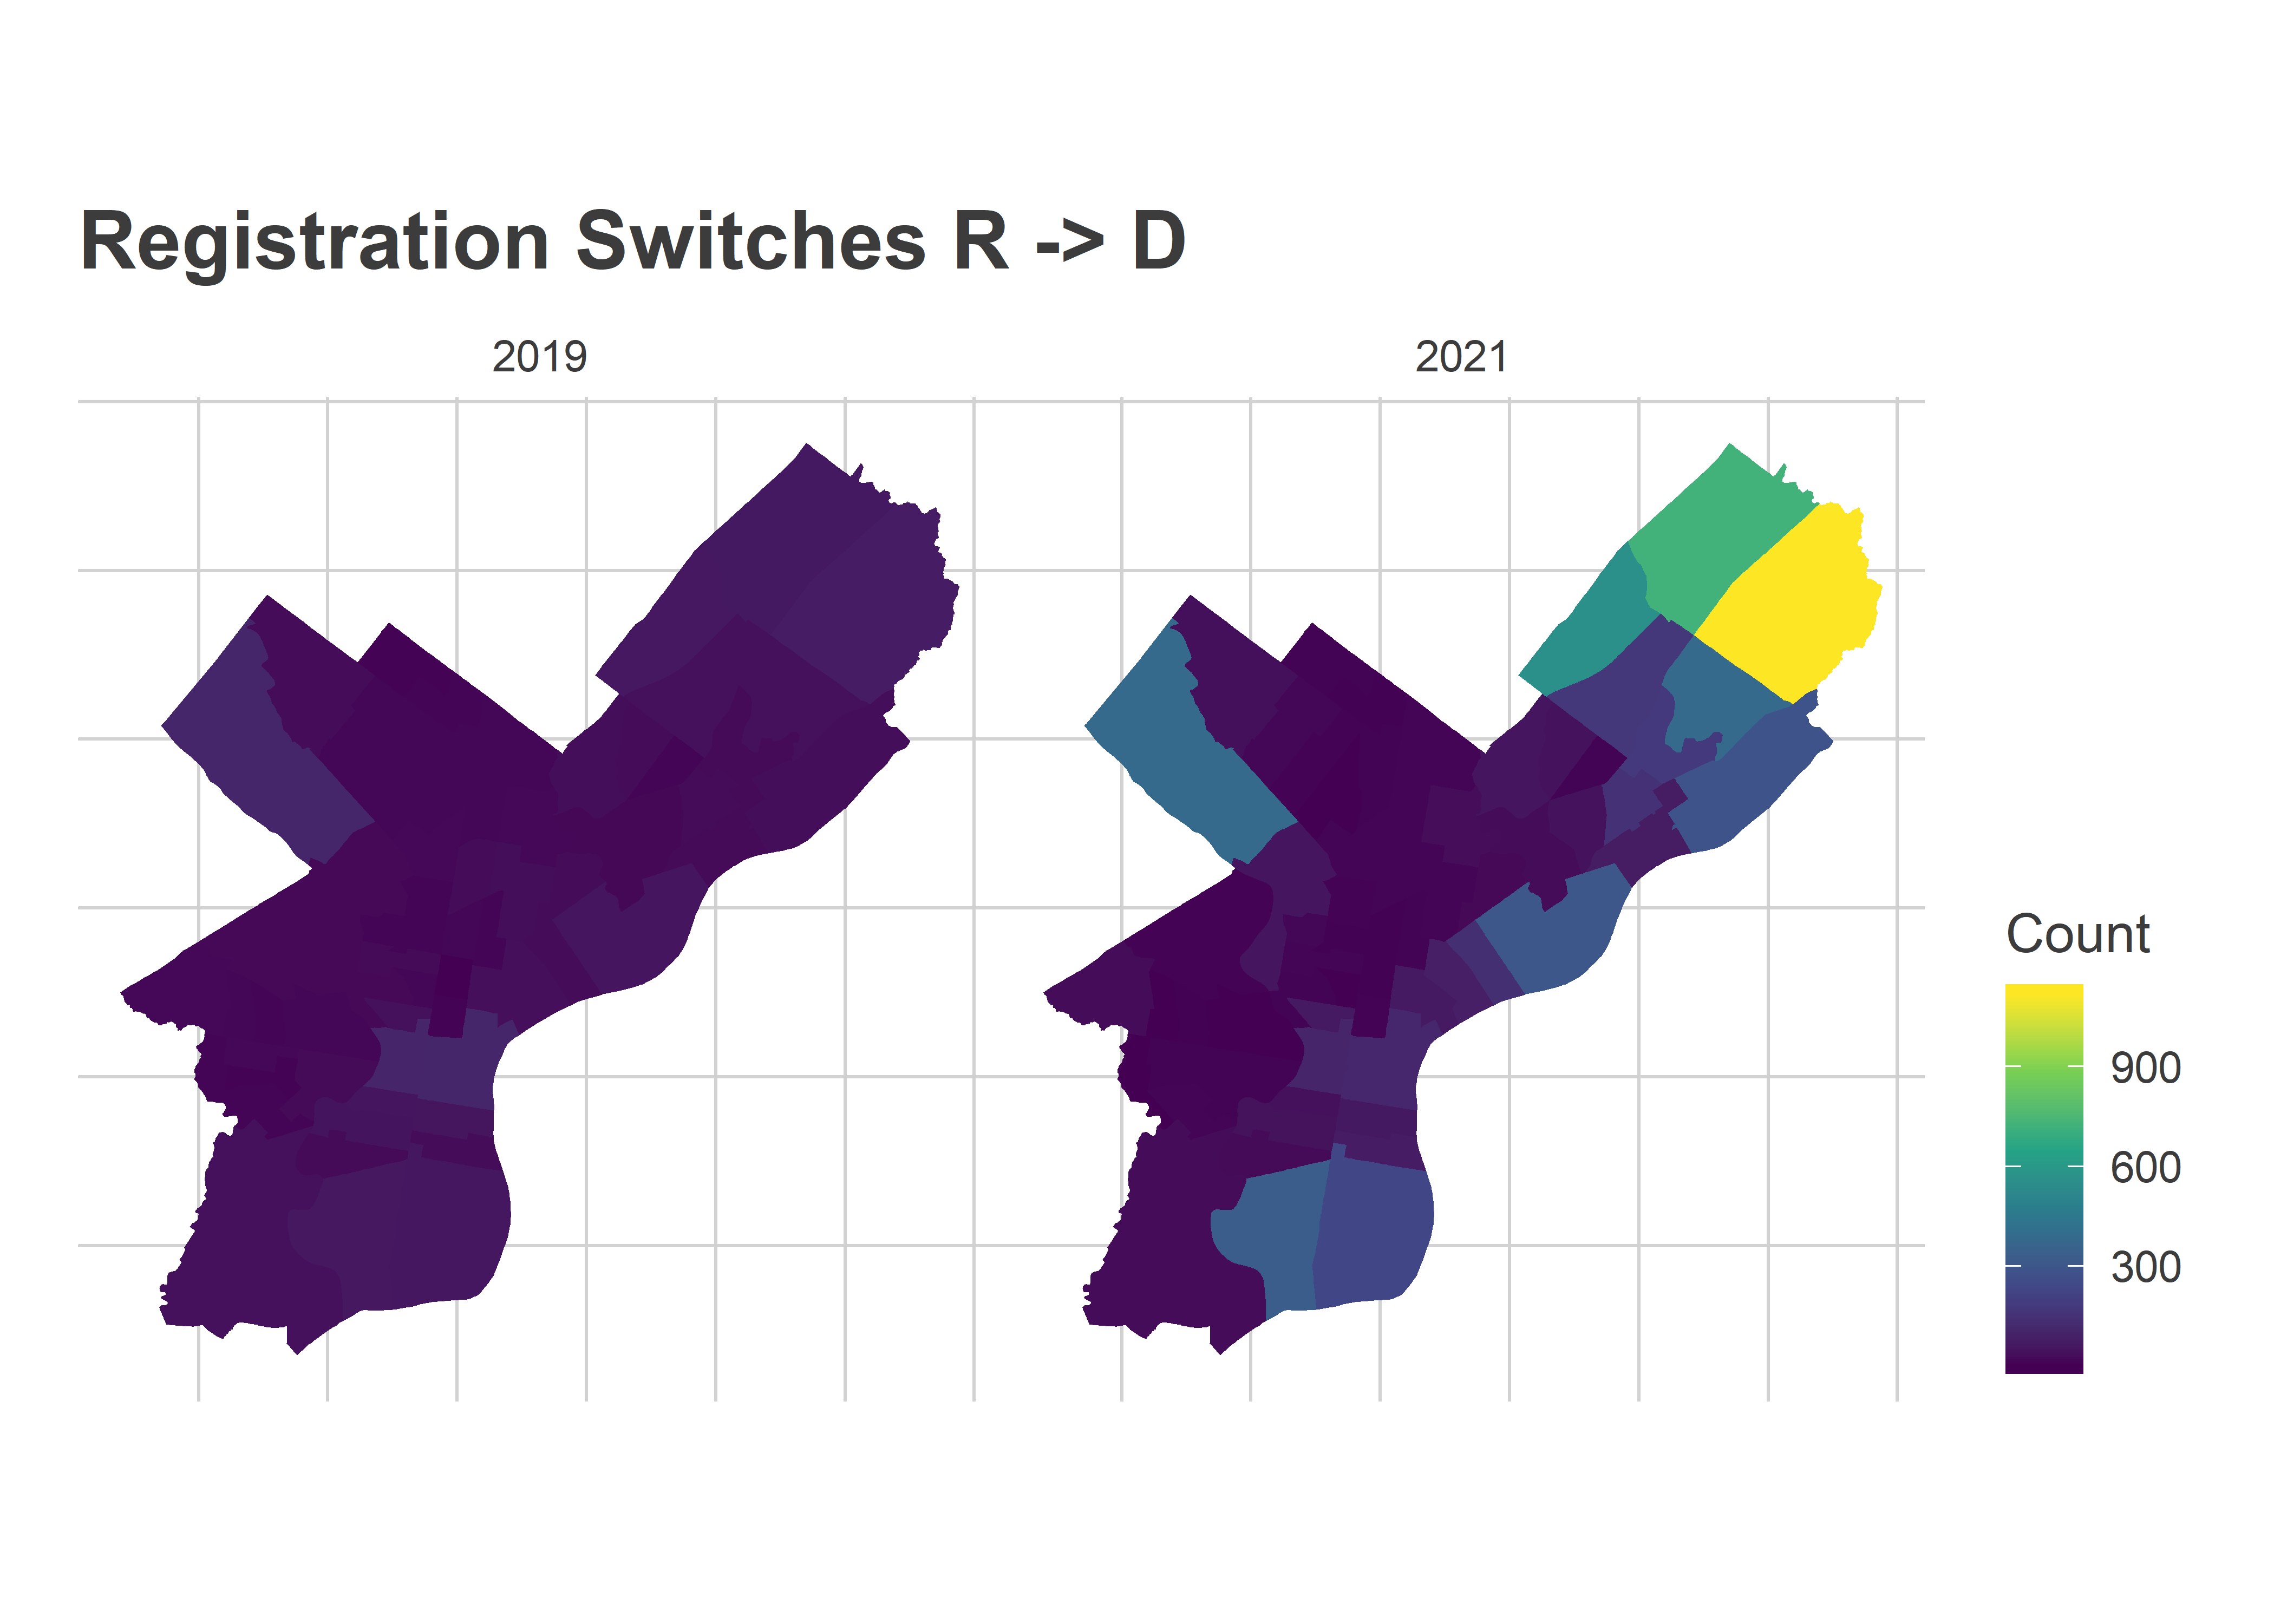
In my piece on the DA’s race, I didn’t discuss one of the most discussed aspect of this race, Vega’s work to get Republicans to switch to Democrats, to be able to vote in the closed Primary.
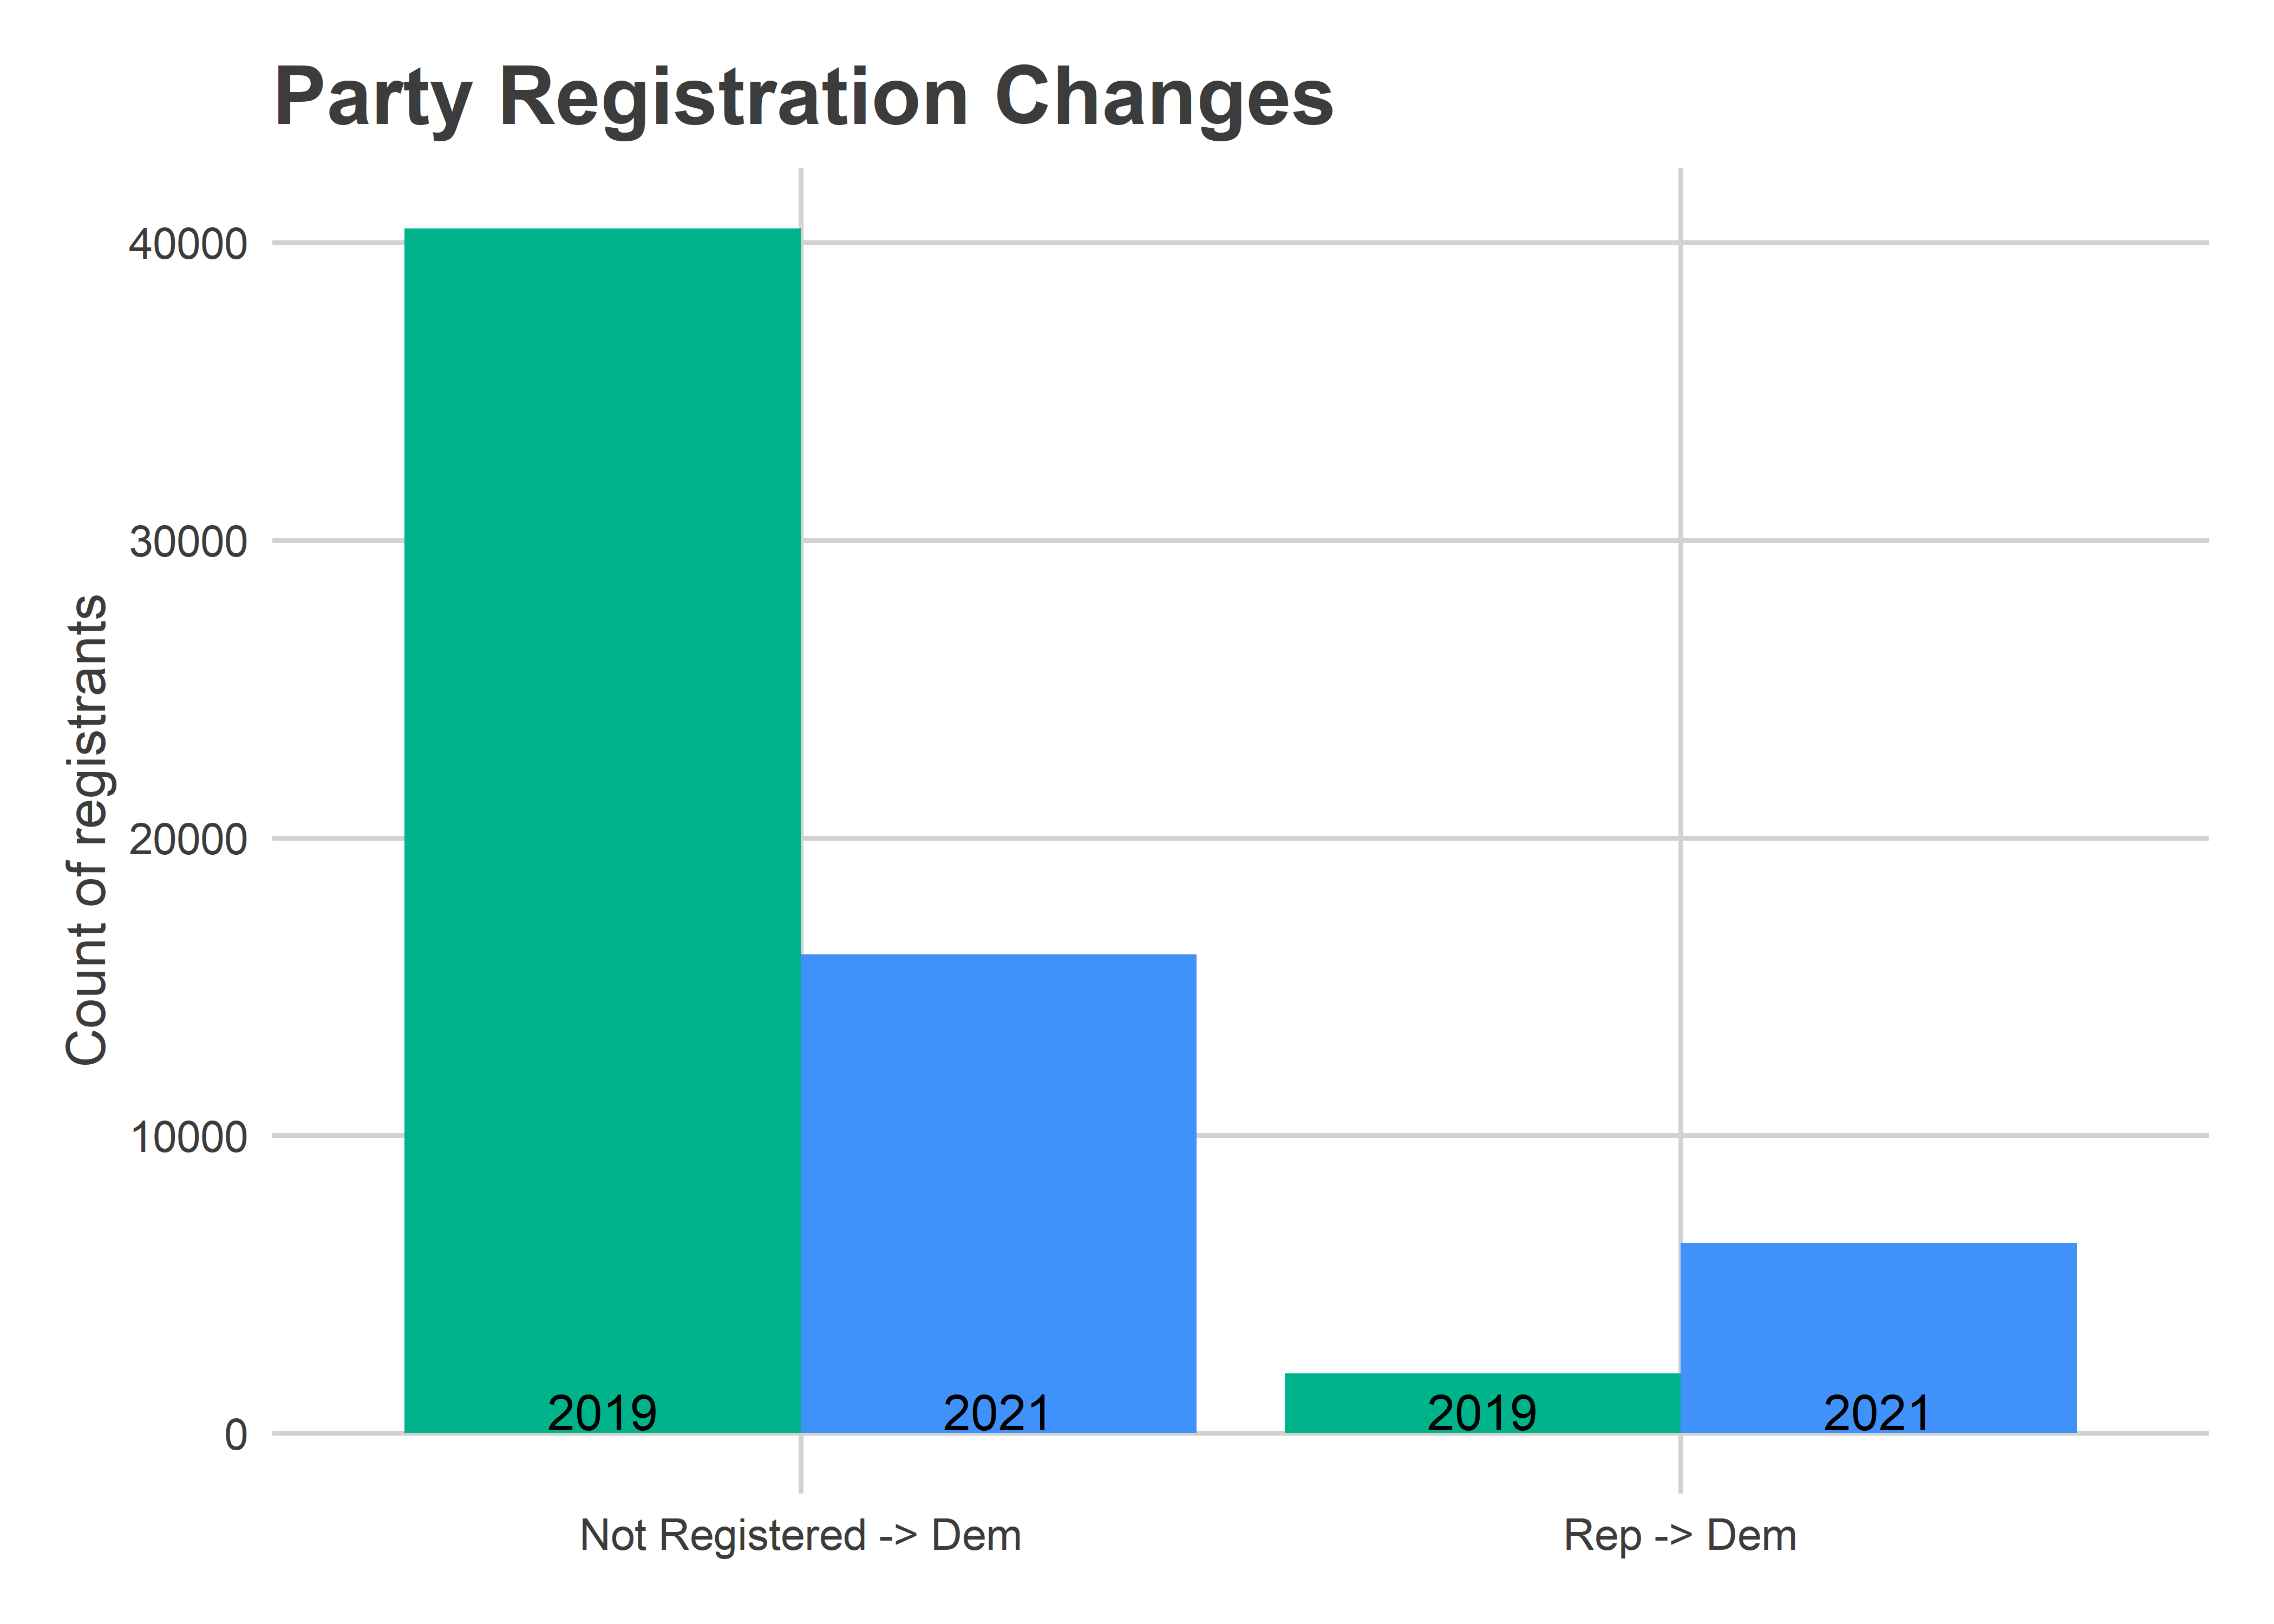
All in all, 6,384 voters had switched their registration from Republican to Democrat since November. That number was 2,006 in 2019, so we certainly have seen a dramatic increase. In an election where we’ll see fewer than 150,000 voters, that’s not nothing. It could swing the election if it’s within a few points.
Note on the data: I only have registration data from an assortment of dates where I happened to buy it, so this isn’t exactly apples to apples. I’ll be comparing today with 2020-10-19, and then 2019-06-24 with 2018-08-06. But the registration data does contain “last changed date”, so I can sanity check the results, and this date mismatch doesn’t appear to make a big difference.
View code
library(dplyr)
library(tidyr)
library(ggplot2)
library(sf)
devtools::load_all("../../admin_scripts/sixtysix/")

fve_names <- read.csv("../../data/voter_registration/col_names.csv")

read_fve <- function(ds){
  path <- sprintf(
    "../../data/voter_registration/%1$s/PHILADELPHIA FVE %1$s.txt",
    ds
  )
  fve <- readr::read_tsv(
    path,
    col_types = paste0(rep("c", nrow(fve_names)), collapse=""),
    col_names = as.character(fve_names$ï..name)
  ) %>%
    mutate(
      party = case_when(
        `Party Code` %in% c("D", "R", NA) ~ as.character(`Party Code`),
        TRUE~"Oth"
      ),
    )
  fve
}

lagged_fve <- function(first, second){
  first <- read_fve(first)
  second <- read_fve(second)
  second <- second %>%
    left_join(
      first %>% select(`ID Number`, party, `Street Name`),
      by="ID Number",
      suffix=c(".1", ".0")
    ) %>%
    mutate(
      party_switch = paste0(party.0, "_", party.1),
      ward =  substr(`Precinct Code`, 1, 2),
      warddiv = paste0(ward, "-", substr(`Precinct Code`, 3, 4))
    )
  second
}

fve_19 <- lagged_fve("20180806", "20190624")
fve_21 <- lagged_fve("20201019", "20210510")

fve_21 %>% with(table(party.0, party.1, useNA="always"))
fve_19 %>% with(table(party.0, party.1, useNA="always"))

ward_reg_21 <- fve_21 %>%
  group_by(ward, party_switch) %>%
  summarise(n=n())

ward_reg_19 <- fve_19 %>%
  group_by(ward, party_switch) %>%
  summarise(n=n())

wards <- st_read("../../data/gis/warddivs/201911/Political_Wards.shp") %>%
  mutate(ward=sprintf("%02d", as.numeric(as.character(WARD_NUM))))ggplot(
  wards %>%
    left_join(
      bind_rows(
        `2021`=ward_reg_21 %>% filter(party_switch=="R_D"),
        `2019`=ward_reg_19 %>% filter(party_switch=="R_D"),
        .id="year"
      )
    )
) +
  geom_sf(
    aes(fill=n),
    color=NA
  ) +
  scale_fill_viridis_c() +
  facet_wrap(~year) +
  theme_map_sixtysix() %+replace%
  theme(legend.position = "right") +
  labs(
    title="Registration Switches R -> D",
    fill="Count"
  )
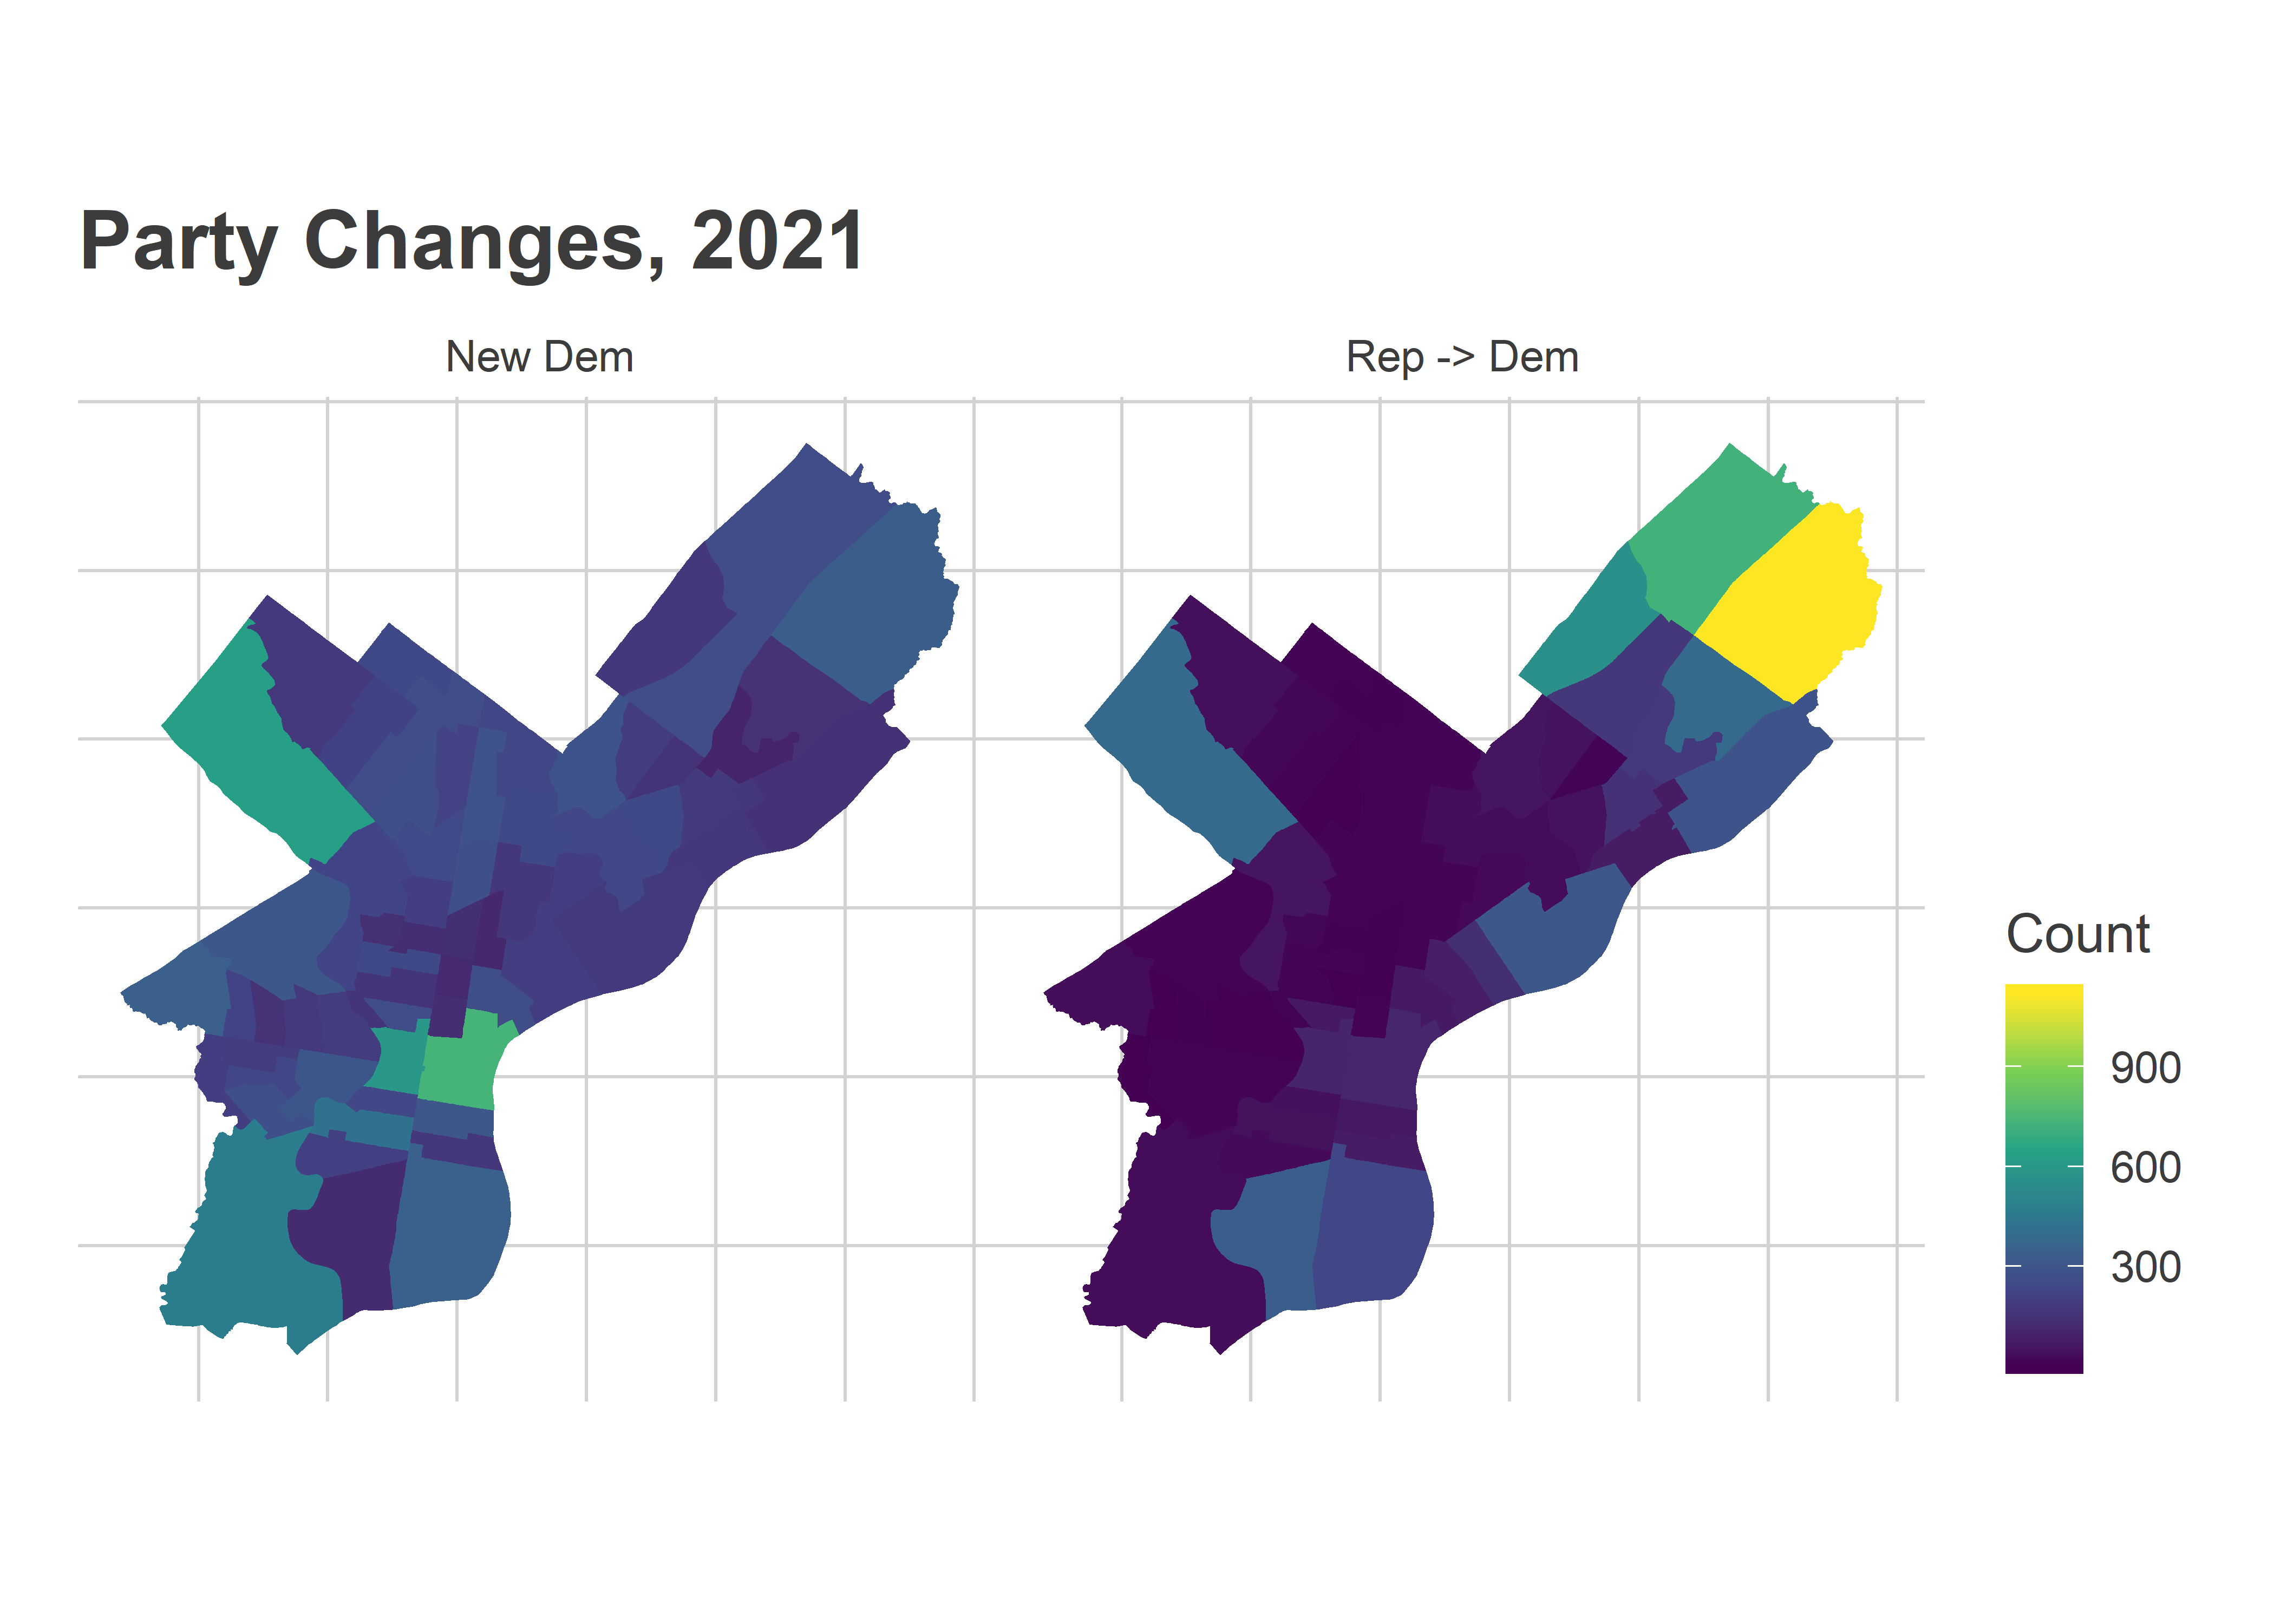
To put the number in perspective, compare it to the total number of Democratic new registrants who weren’t registered in Philadelphia in November (they either moved from elsewhere, or are new voters).
View code
ggplot(
  wards %>%
    left_join(
      ward_reg_21 %>%
        filter(party_switch %in% c("NA_D", "R_D")) %>%
        mutate(party_switch = case_when(
          party_switch == "NA_D" ~ "New Dem",
          party_switch == "R_D" ~ "Rep -> Dem"
        ))
    )
) +
  geom_sf(
    aes(fill=n),
    color=NA
  ) +
  scale_fill_viridis_c() +
  facet_wrap(~party_switch) +
  theme_map_sixtysix() %+replace%
  theme(legend.position = "right") +
  labs(
    title="Party Changes, 2021",
    fill="Count"
  )
Despite high number of transitions in the Northeast, overall new registrants who are Dems greatly outnumber Rep to Dem switches. But that gap is smaller than in 2019. (Comparing 2021 to 2019 isn’t exactly apples-to-apples, since we’re now coming off a Presidential election and a lot more people probably registered last summer than summer 2018.)
View code
ggplot(
  bind_rows(
    `2021`=ward_reg_21,
    `2019`=ward_reg_19,
    .id="year"
  ) %>%
    filter(party_switch %in% c("NA_D", "R_D")) %>%
    mutate(party_switch = case_when(
      party_switch == "NA_D" ~ "Not Registered -> Dem",
      party_switch == "R_D" ~ "Rep -> Dem"
    )) %>%
    group_by(party_switch, year) %>%
    summarise(n=sum(n), .groups = "drop") %>%
    arrange(desc(n)) %>%
    mutate(party_switch = factor(party_switch, levels=unique(party_switch))),
  aes(x=party_switch, y=n)
) +
  geom_col(
    aes(group=year, fill=year),
    position="dodge"
  ) +
  scale_fill_manual(
    values=c(
      `2021`=colors_sixtysix()$light_blue,
      `2019`=colors_sixtysix()$light_green
    ),
    guide=FALSE
  ) +
  theme_sixtysix() +
  annotate(
    "text",
    x=c(1-0.45/2,1+0.45/2,2-0.45/2,2+0.45/2),
    y=0,
    vjust=-0.1,
    label=c(2019, 2021, 2019, 2021)
  ) +
  labs(
    title="Party Registration Changes",
    x=NULL,
    y="Count of registrants"
  )