November finally brings the all-important presidential election, obviously. But it also brings races for half of Pennsylvania’s State Senate and all of its State House. The Senate has been held by Republicans since 1994, the House since 2011. With Biden currently running six points ahead of Trump in Pennsylvania, could Democrats take back one of the houses? Both?
Today, let’s consider the Senate.
Pennsylvania’s Senate consists of 50 senators serving four-year terms; 25 are elected every two years. Following the 2016 election, Republicans held 34 seats to Democrats’ 16. In 2018, the Democratic wave shrunk that gap: Democrats won 12 of 25 seats, including 5 that had been held by Republicans, to bring the body to 29 Republicans, 21 Democrats.
Today that balance still stands: 29 to 21. It’s not exactly the same district breakdown as January 2019 ( one Democrat became an independent and started caucusing with Republicans, and formerly-Republican PA-37 was won by a Democrat in a 2019 Special Election.) For this election that means that Democrats need to win 5 more seats than the 9 they pulled off in 2016. That’s the same net gain they got in 2018, and PA-37 has already flipped in its special election.
Waves are less likely in presidential elections than gubernatorial ones. Is five pick-ups possible? For this analysis, I’ve got data from the Open Elections Project for 2012-2016 and from the inimitable Ben Forstate for 2018. Let’s dig in.
The Republican Seats that voted for Clinton
In 2016, three Senate seats were won by Republicans by less than 10 points (within 55-45 Republican), and another seat by 10-20 points (within 60-40). (All of the percents below are two-party percentages, ignoring third parties.)
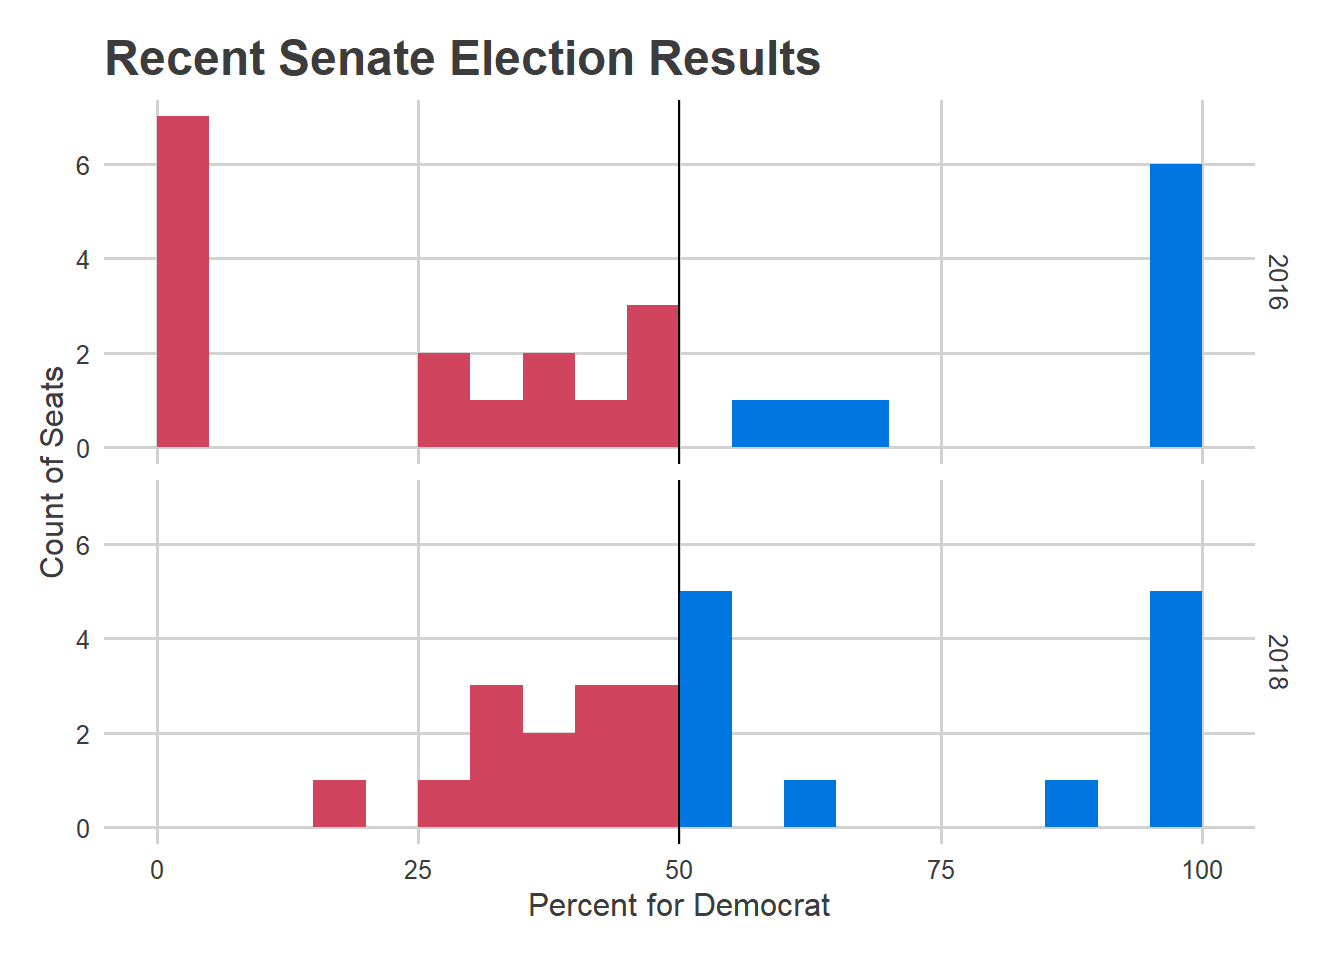
Aside: Notice how the Senate districts have many more Republican wins with ranges of 50-75% of the vote than Democratic ones. That’s a hallmark of gerrymandering; you want your side to win as many seats as possible, but not have any seat be such a landslide so as to waste votes.
Only four 2016 seats sit in the 40-50% Democratic bucket, with another two at 39 and 38%. To get five pick-ups vis a vis 2016, Democrats need to win at least one seat where they received less than 40% of the vote four years ago.
Those pick-ups would have probably needed to come from districts that supported Clinton in 2016 but have Republican Senators. In the 2018 wave, every single Democratic pick-up came from a district Clinton won with 50 to 60% of the vote. Among the nine districts in that bucket, Democrats entered the election with two senators, and emerged with seven. That includes Allegheny County’s PA-38, where Democrats didn’t even field a candidate in 2014, but then managed to win the seat.
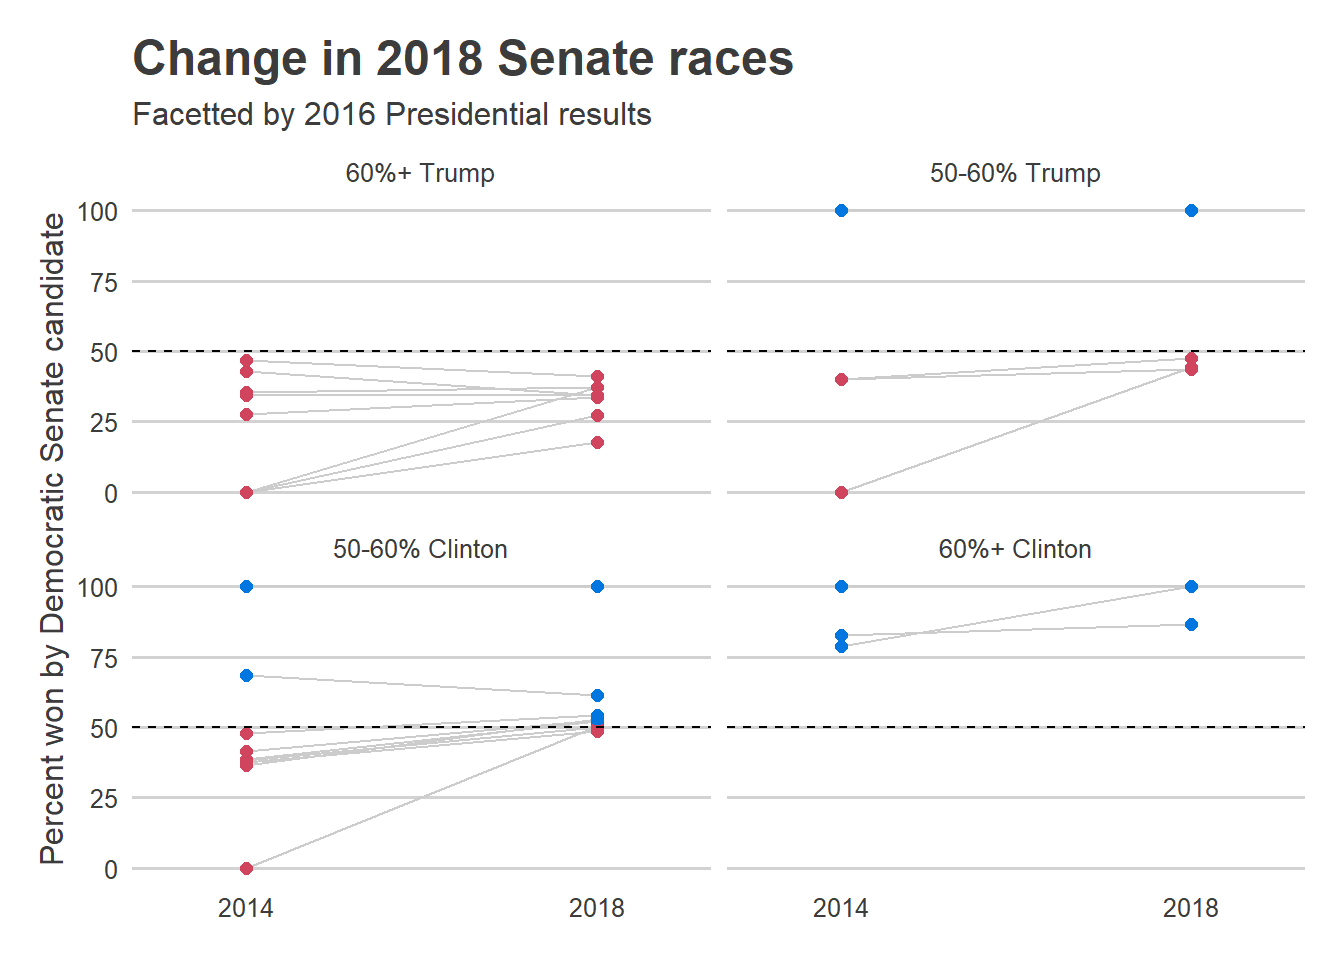
Among those districts, the swing to Democratic senators was large. Filtering to only distrcits that voted for Clinton with 50-60% of the vote but for a Republican Senator in 2014 (excluding 2014-uncontested PA-38, whose swing was even larger), Democrats won an average 11.6 percentage points more of the vote in 2018 than 2014. 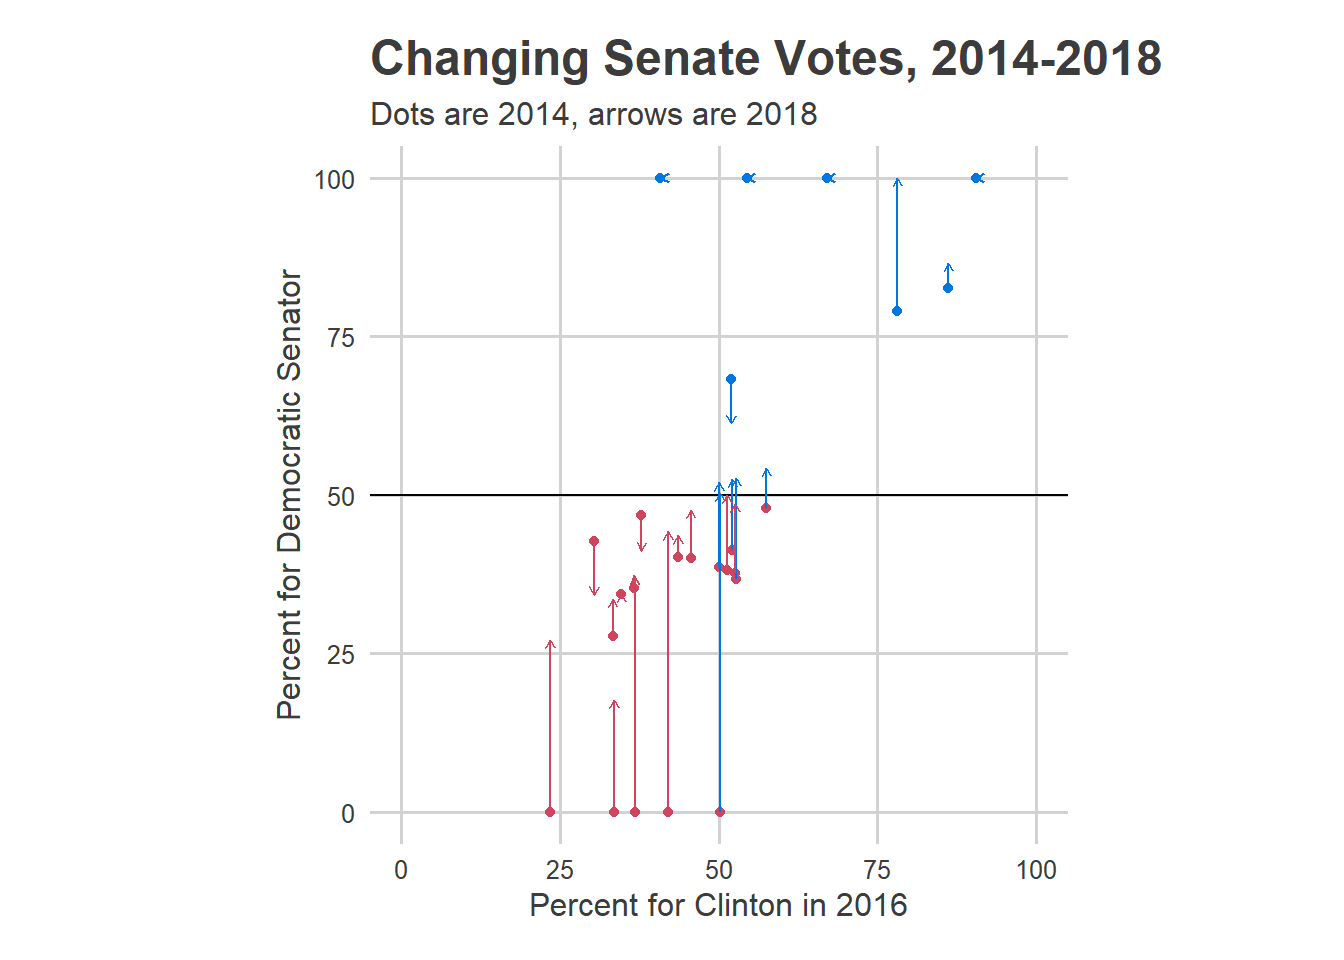
The problem for Democrats this year is that not enough of those seats exist. Instead, they’ll have to hope some Trump districts change their minds.
What seats might be in play?
I’ll use just two data points:
- The Senate result in 2016.
- The presidential election in 2016.
There are six seats that were won by Republican senators in 2016 with less than 63% of the vote. Unlike in 2018, when a vast majority of them voted for Clinton, only two of these districts voted for Clinton (this election was in 2016, so anti-Trump sentiment is already somewhat baked in to the Senate results). Those two are Delco and Chester’s PA-9 and Erie’s PA-49. Clinton won 46.7% or more in three of the other ones: Lancaster’s PA-13, Perry’s PA-15, and Allegheny’s 27. The sixth district that was competitive in the senate in 2016 was Bedford’s PA-35, but that district only gave Clinton 26% of the vote in 2016, and even voted 62% for Wagner in a 2018 gubernatorial election that Wolf dominated. It’s probably a tough sell.
So Democrats need five pick-ups, and there are exactly five seats within striking distance using the simple analysis above. Interestingly, the longest shot of them would appear be PA-37, where in 2016 Trump won 53% of the vote and Republican Guy Reschenthaler won 61%. But that’s the seat with a Democratic incumbent thanks to the 2019 Special Eleciton.
Two of the five are in our (extended) backyard: Delco/Chester and Lancaster. In Delco and Chester’s PA-9, incumbent Thomas Killion is being challenged by John Kane; in Lancaster’s PA-13, incumbent Scott Martin is being challenged by Janet Diaz.
(* – “Last Senate Result” means the last General election (2016 or 2018), and ignores special elections or party changes.)
The tough road for Democrats
The PA senate will be tough for Democrats. They need to replicate the 2018 wave, in a cycle where waves are harder. There are exactly five districts that appear to be within reach, and they’d need all five (of course, there could always be a PA-38 lurking in the shadows). Further, three of those five pick-ups would need to be from districts that in 2016 voted for Trump, and not a single of their 2018 pick-ups came from that type of district.
Coronavirus, mail-in voting, and a historically unpopular president make for an election where bigger-than-normal swings might happen. Democrats need every bit of uncertainty to resolve in their favor.
Up next, the Pennsylvania House.