The State of the Senate

November finally brings the all-important presidential election, obviously. But it also brings races for half of Pennsylvania’s State Senate and all of its State House. The Senate has been held by Republicans since 1994, the House since 2011. With Biden currently running six points ahead of Trump in Pennsylvania, could Democrats take back one of the houses? Both?

Today, let’s consider the Senate.

Pennsylvania’s Senate consists of 50 senators serving four-year terms; 25 are elected every two years. Following the 2016 election, Republicans held 34 seats to Democrats’ 16. In 2018, the Democratic wave shrunk that gap: Democrats won 12 of 25 seats, including 5 that had been held by Republicans, to bring the body to 29 Republicans, 21 Democrats.

Today that balance still stands: 29 to 21. It’s not exactly the same district breakdown as January 2019 ( one Democrat became an independent and started caucusing with Republicans, and formerly-Republican PA-37 was won by a Democrat in a 2019 Special Election.) For this election that means that Democrats need to win 5 more seats than the 9 they pulled off in 2016. That’s the same net gain they got in 2018, and PA-37 has already flipped in its special election.

Waves are less likely in presidential elections than gubernatorial ones. Is five pick-ups possible? For this analysis, I’ve got data from the Open Elections Project for 2012-2016 and from the inimitable Ben Forstate for 2018. Let’s dig in.

The Republican Seats that voted for Clinton

In 2016, three Senate seats were won by Republicans by less than 10 points (within 55-45 Republican), and another seat by 10-20 points (within 60-40). (All of the percents below are two-party percentages, ignoring third parties.)

Aside: Notice how the Senate districts have many more Republican wins with ranges of 50-75% of the vote than Democratic ones. That’s a hallmark of gerrymandering; you want your side to win as many seats as possible, but not have any seat be such a landslide so as to waste votes.

Only four 2016 seats sit in the 40-50% Democratic bucket, with another two at 39 and 38%. To get five pick-ups vis a vis 2016, Democrats need to win at least one seat where they received less than 40% of the vote four years ago.

Those pick-ups would have probably needed to come from districts that supported Clinton in 2016 but have Republican Senators. In the 2018 wave, every single Democratic pick-up came from a district Clinton won with 50 to 60% of the vote. Among the nine districts in that bucket, Democrats entered the election with two senators, and emerged with seven. That includes Allegheny County’s PA-38, where Democrats didn’t even field a candidate in 2014, but then managed to win the seat.
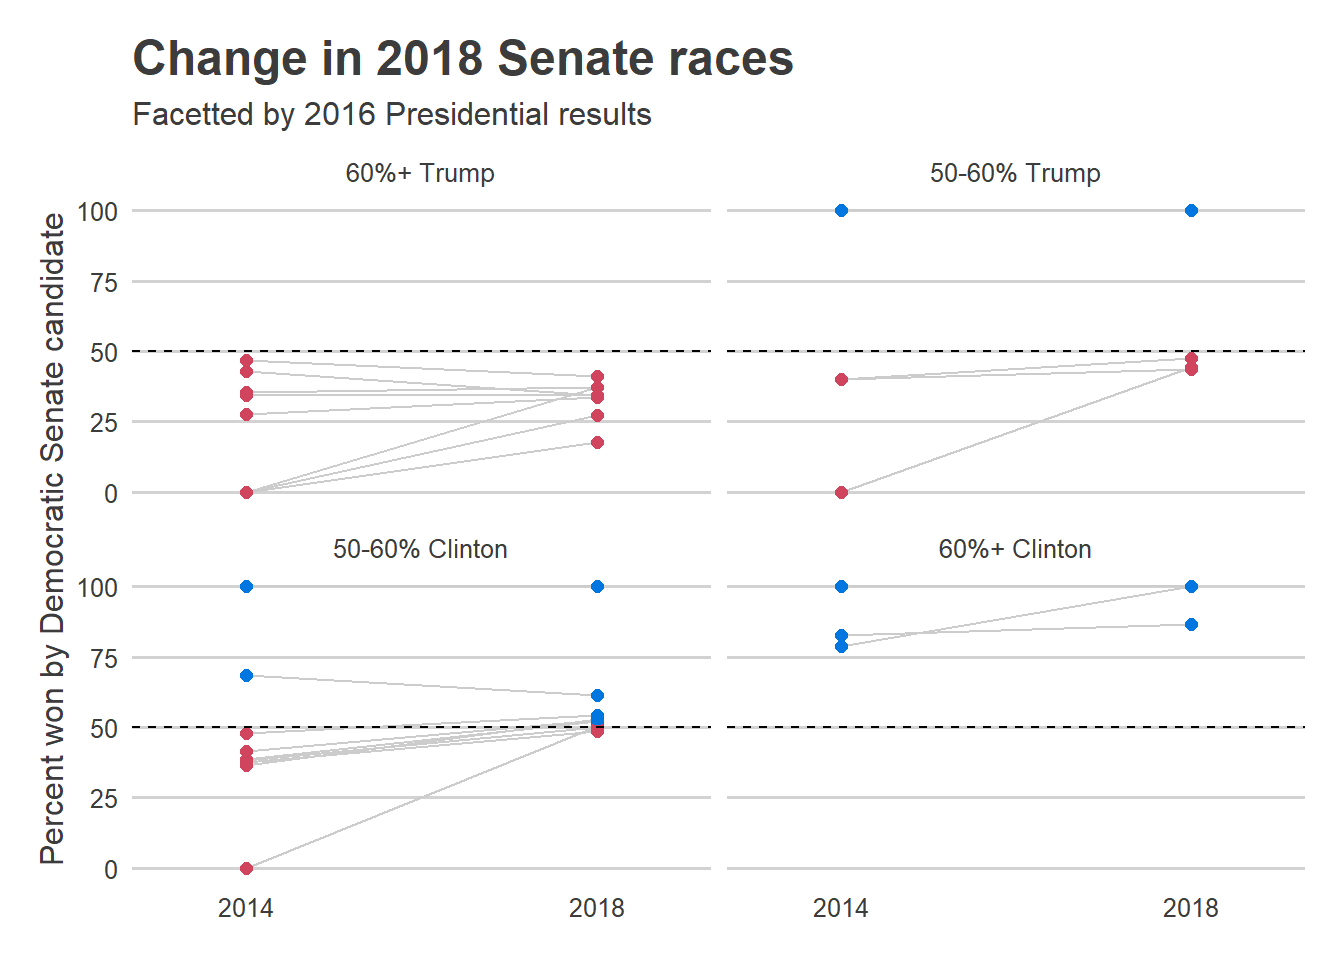
Among those districts, the swing to Democratic senators was large. Filtering to only distrcits that voted for Clinton with 50-60% of the vote but for a Republican Senator in 2014 (excluding 2014-uncontested PA-38, whose swing was even larger), Democrats won an average 11.6 percentage points more of the vote in 2018 than 2014.
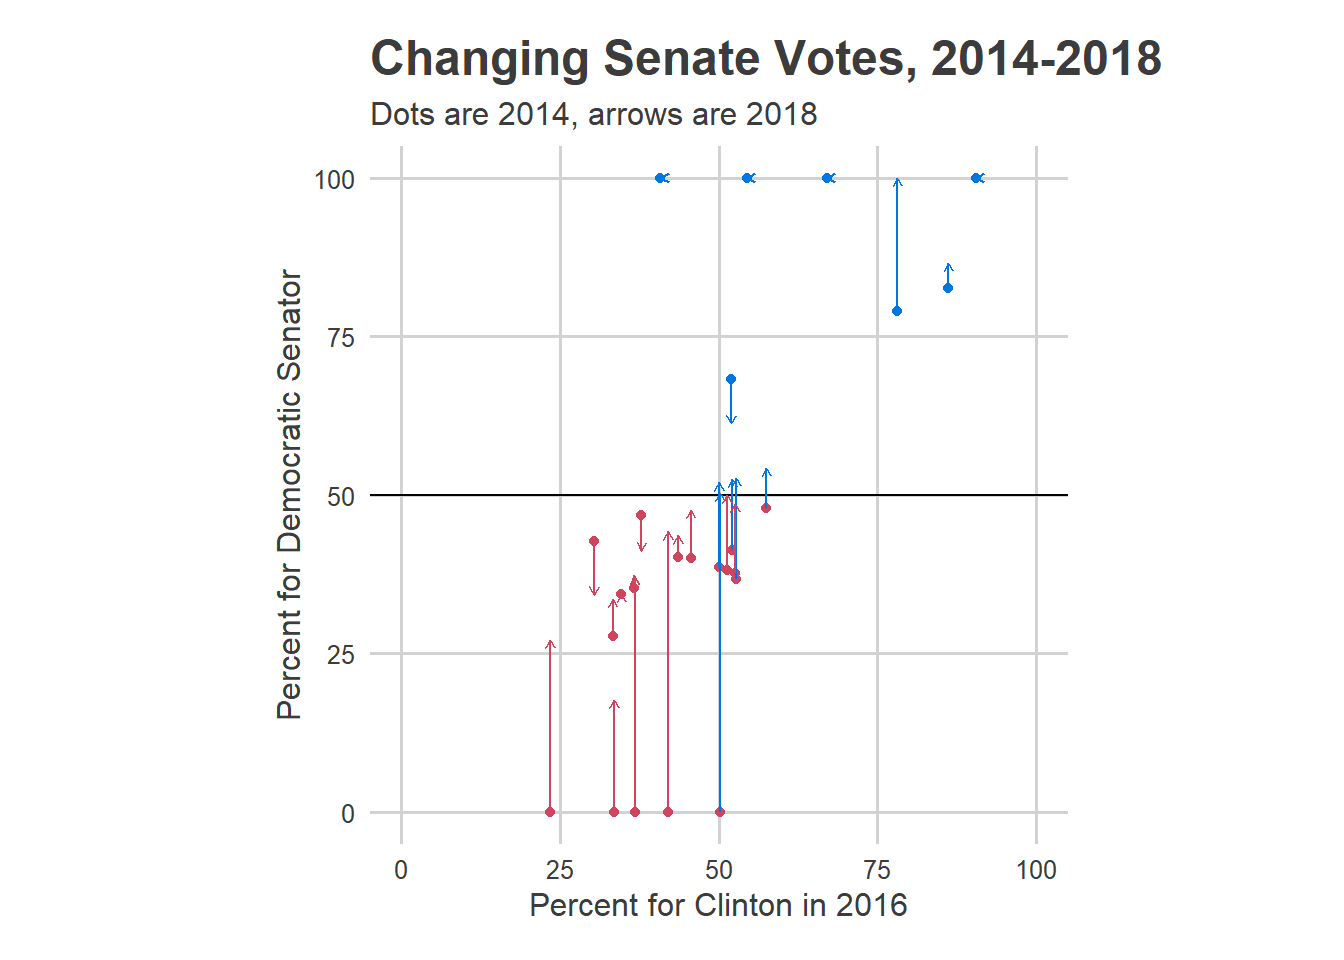
The problem for Democrats this year is that not enough of those seats exist. Instead, they’ll have to hope some Trump districts change their minds.

What seats might be in play?

I’ll use just two data points:

  • The Senate result in 2016.
  • The presidential election in 2016.

There are six seats that were won by Republican senators in 2016 with less than 63% of the vote. Unlike in 2018, when a vast majority of them voted for Clinton, only two of these districts voted for Clinton (this election was in 2016, so anti-Trump sentiment is already somewhat baked in to the Senate results). Those two are Delco and Chester’s PA-9 and Erie’s PA-49. Clinton won 46.7% or more in three of the other ones: Lancaster’s PA-13, Perry’s PA-15, and Allegheny’s 27. The sixth district that was competitive in the senate in 2016 was Bedford’s PA-35, but that district only gave Clinton 26% of the vote in 2016, and even voted 62% for Wagner in a 2018 gubernatorial election that Wolf dominated. It’s probably a tough sell.

So Democrats need five pick-ups, and there are exactly five seats within striking distance using the simple analysis above. Interestingly, the longest shot of them would appear be PA-37, where in 2016 Trump won 53% of the vote and Republican Guy Reschenthaler won 61%. But that’s the seat with a Democratic incumbent thanks to the 2019 Special Eleciton.

Two of the five are in our (extended) backyard: Delco/Chester and Lancaster. In Delco and Chester’s PA-9, incumbent Thomas Killion is being challenged by John Kane; in Lancaster’s PA-13, incumbent Scott Martin is being challenged by Janet Diaz.

(* – “Last Senate Result” means the last General election (2016 or 2018), and ignores special elections or party changes.)

The tough road for Democrats

The PA senate will be tough for Democrats. They need to replicate the 2018 wave, in a cycle where waves are harder. There are exactly five districts that appear to be within reach, and they’d need all five (of course, there could always be a PA-38 lurking in the shadows). Further, three of those five pick-ups would need to be from districts that in 2016 voted for Trump, and not a single of their 2018 pick-ups came from that type of district.

Coronavirus, mail-in voting, and a historically unpopular president make for an election where bigger-than-normal swings might happen. Democrats need every bit of uncertainty to resolve in their favor.

Up next, the Pennsylvania House.

We closed 645 polling places due to Covid-19. That cost us 19,000 votes.

How many votes were lost due to polling place closures?

In response to the unprecedented pandemic, City Commissioners consolidated polling places ahead of the 2020 Primary. Instead of the 832 polling places in the 2019 Primary, voters were only given 188. The result is that voters in many Divisions had to travel farther to vote on Election Day (if they voted in person). How many votes did that cost us?

NOTE: I want to say up front that the City closing polling places may have been the optimal decision among bad choices. The election took place in the heart of the pandemic, and I am not claiming that there was a better strategy, with shortages of poll workers and many existing polling places not able to support social distancing. But we can, in retrospect, use the consolidation to understand the importance of polling place location, and make sure we do better in November.

Data note 1: I’m filtering out Divisions whose boundaries have changed since 2019.

The median distance from a Division’s centroid to its polling place more than doubled this election, from 0.16 miles in the 2019 Primary to 0.37 in 2020.

What happened to turnout in places where the distances greatly changed?

Data note 2: I compare distance to polling place in 2020 to that of 2019, but will compare turnout in 2020 to that of 2016. Because polling places were very stable over time until this year, that’s not a big deal. To whatever extent the distances in 2016 were different from 2019, that’ll cause attenuation in my estimates, meaning the turnout changes due to distances are actually larger than what I state.

First, how far did polling places move? The most common distance in 2019 was between 0.10-0.25 miles, comprising 827 Divisions. Among those, 540 had their polling place moved to more than a 0.25 mile distance in 2020. In total, of the 1,655 Divisions I’m considering, 1,304 had to travel farther in 2020 than in 2019, and 660 had the distance increase by more than 1/4 mile.

Among Divisions that were close to their polling place in 2019, there was a fall-off in voting when they were moved farther away in 2020. For example, among Divisions that stayed within 0.1 miles in both 2019 and 2020, 2020 turnout was 93% of 2016. But among the 148 Divisions that moved from within 0.1 mile away to only within 0.5 miles away, turnout was 83% of 2016 turnout.

That fall was smaller than it could have been, and was mitigated by voters strategically using mail-ins. Among the Divisions that moved farther away, in-person voting fell sharply, but mail-in voting rose to somewhat counteract the decline. Among the Divisions that stayed within 0.1 miles, for example, in-person turnout was 55.2% of 2016 turnout, and mail-in votes were 37.4% of 2016 turnout (giving the 93% from above). But among those that moved from within 0.1 miles to within only 0.5 miles, in-person turnout was 39%, and mail-in only rose to 44%.

I’ve shown before that mail-in voting had strong differences by voting bloc. And those played out sharply in how distance changed turnout.

Black Voter Divisions showed the strongest fall-off when Divisions were moved farther away, with some evidence of mail-in mitigating the gap. Wealthy Progressives also showed some fall-off, though they heavily used mail-in voting everywhere. Hispanic North Philly Divisions, on the other hand, showed the lowest use of mail-in ballots (Notice that this is even as a fraction of 2016 votes! And in 2016 they were already among the lowest turnout.)

There are two important things that the above analysis doesn’t account for: differences in where races were competitive, and uncertainty. To explore that, I fit a regression with state house district fixed effects, and bootstrap the polling places to provide clustered uncertainty.

The plot below shows the percentage point difference in (turnout 2020 / turnout 2016) between a Division in a given distance bucket and the Divisions that were in the (0,0.1] bucket in both 2016 and 2020.

For example, a Division that was within 0.1 miles in 2016 but moved to within only 0.25 miles in 2020 saw in-person turnout (relative to 2016) 7.7 percentage points lower than a Division that stayed at 0.1 miles.

There are two caveats with this analysis. First, using fixed effects means I can’t differentiate by voting bloc; there aren’t enough districts with multiple voting blocs in them. Second, it assumes that the Commissioners were not anticipating which Divisions would vote disproportionately and choosing the exact placement of the polls accordingly. This strikes me as a reasonable assumption, controlling for state house district, but I can’t prove it.

So how many votes did moving polling places cause? For each polling place, I calculate what the votes would have been using the 2019 distance, instead of the 2020 distance. (This assumes full causality of the coefficients. For instance, it assumes that in no way were the polling places moved in anticipation of how votes would disproportionately fall.)

Among the Divisions we’re considering, there were 378K votes in the 2016 primary, and 332K votes in the 2020 primary (mail-ins and in-person combined). Moving each Divisions to its 2019 distance, we would have seen 351K votes (with a 95% confidence interval of 340K-365K).

Looking ahead to November

Who knows what Covid-19 will look like in November. We may be in the heart of a second wave, and voting in person may bear significant risk. But closing polling places costs votes. It’s incumbent on us to figure out how to keep as many polls open, and to increase the use of mail-in voting to help voters better adapt to a sparse polling place world.