The GOP just proposed new Congressional boundaries. They are… still bad.

Pennsylvania Republicans submitted a new map of proposed Congressional Districts to Governor Wolf on Friday. He has until Thursday to approve it and send it to the State Supreme Court.

I’ve downloaded the boundaries from pubintlaw, and created an interactive map. In order to project how each district would perform, I’ve aggregated the results of the races for President in 2016 and Governor in 2014. Let’s dig in.

You can visit the full-scale interactive maps here.

The GOP’s proposal clearly creates compact boundaries that align with county boundaries much more often. While this is what most people focus on with gerrymandering, I think the compactness standard is nonsense: it is completely possible to waste a party’s votes with compact boundaries if perniciously drawn. In fact, the concentration of Democrats in cities means that even naive compact districts will almost certainly favor Republicans.

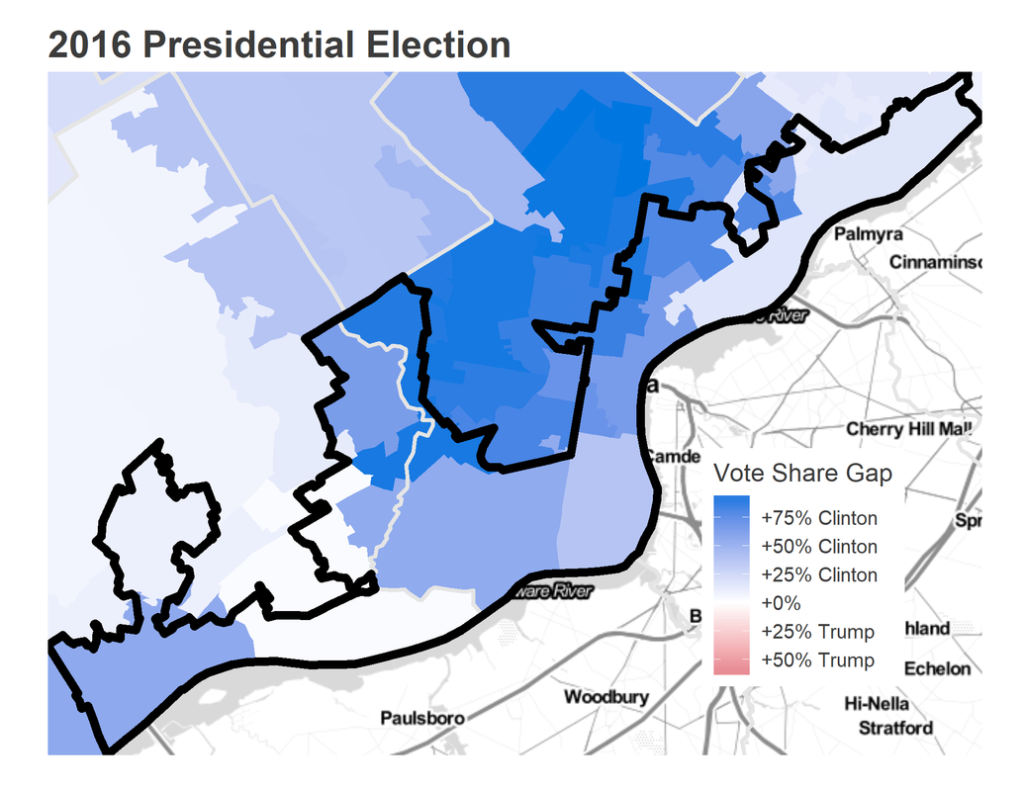
The new districts maintain the exact same Republican advantage as the prior ones. To assess this, let’s look at the outcome of the 2016 Presidential election. Donald Trump narrowly won Pennsylvania, with 48.2% of the vote to Hillary Clinton’s 47.5%. However, he won 12 of the Congressional Districts to Clinton’s 6 (and in total 13 Republican House members won to Democrats’ 5). This imbalance between topline vote and district count was achieved by packing Democrats all into a few districts, to waste their votes in landslide elections, leaving comfortable but not wasteful Repubican wins in the rest of the state.

With respect to the 2016 Presidential election, the new boundaries look a lot like the old ones:

Before we look at the district, notice the asymmetric skew between Republicans and Democrats. Republicans don’t have a single district where they won by more than 50 points (thereby wasting their votes); Democrats have two. Given this, Trump would still have won 12 of the 18 districts under the proposed boundaries. The Democrats are still given the two most wasteful districts: PA-01 and PA-02, both in Philadelphia. They would continue to comfortably win PA-14, Pittsburgh, and PA-13, in Northeast Philadelphia.

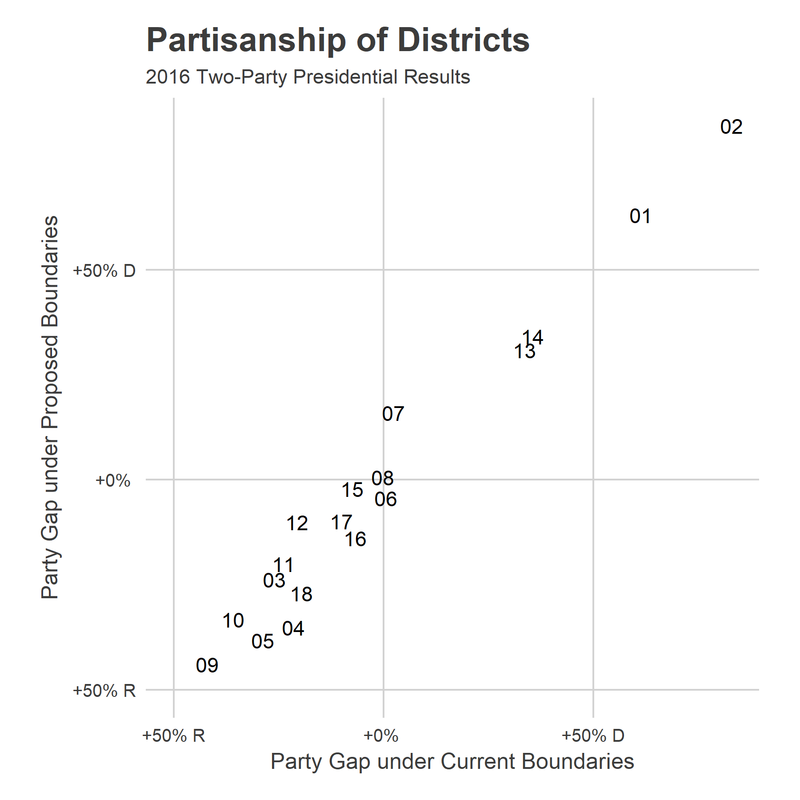
District PA-07 swings hard to the Democrats. That district, famously gerrymandered as “Goofy kicking Donald,” is a convenient sacrifice for Republicans as Representative Pat Meehan has already stepped down from the race amidst sexual misconduct allegations.

By sacrificing PA-07, Republicans make PA-06 a more likely Republican seat. The district, covering the farther-West Philadelphia suburbs, had been narrowly won by Clinton, but would now be a 4.4% Trump win.

PA-08 remains the most evenly split district. It covers the suburbs to Philadelphia’s Northeast: Doylestown, Newtown, et al. It was and would remain essentially 50-50. Clinton would have won it by the slimmest of margins in 2016.

A strong Democratic 2018 could still swing seats. Districts 12 and 17 would have been Trump wins by 10 percentage points under these boundaries. These are the types of seats that we would expect to see competitive in a Democratic wave election. In fact, the logic of gerrymandering may mean that wave elections have more power: gerrymandered seats should be safe but not too safe, to avoid wasting votes, which may put a lot of them in play in a 10-20% Democratic swing.

But we shouldn’t lose sight of just how troubling the baseline assumption in that logic is: Democrats basically need a wave election just to break even. In the dead-even state-wide election of 2016, Republicans won 13 seats to Democrats’ 5 (Trump won only 12; another district split). Just because Democrats may be able to overcome the disadvantage to barely break even doesn’t mean that the districts are fair.

Just to check that 2016 wasn’t a fluke, here is the same plot for the 2014 Governor’s race.

The Governor results are all shifted more Democratic; Wolf won the state with 54.9% of the vote to Corbett’s 45.1%. Despite the rout, Corbett *won more* congressional districts: he won more than half the vote in 10 of 18 districts. The proposed boundaries do nothing to change that. PA-15, representing Allentown, becomes much more Democratic while PA-06 again becomes much more Republican.

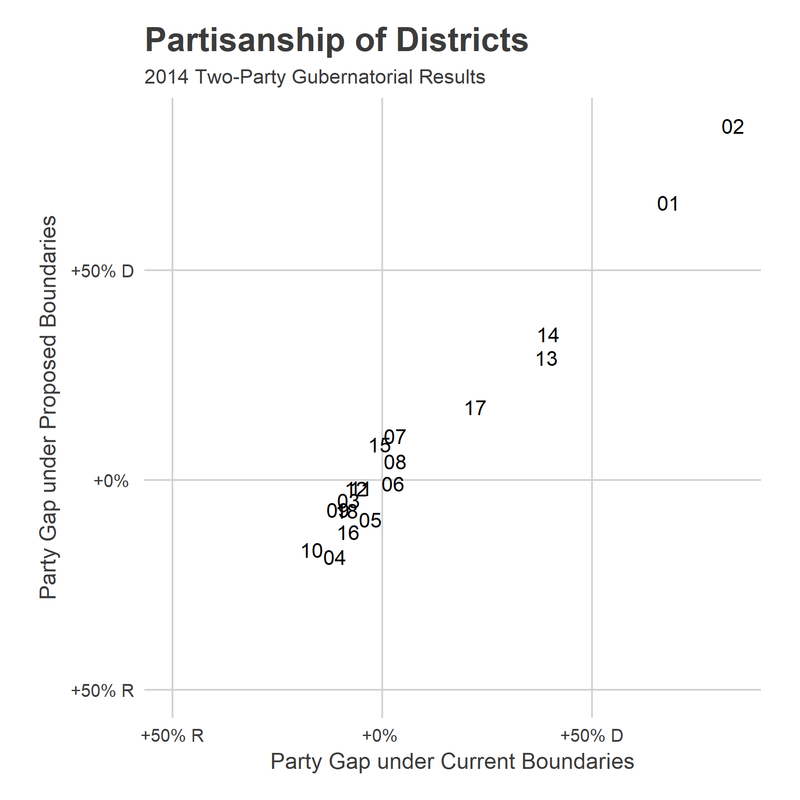
The wasted votes are particularly breathtaking here: Corbett wins 10 of the 18 seats in both scenarios despite losing by 10% overall. And his largest win in a single district is by 18% in the new PA-04; Democrats would win by that much in *four* districts. Their votes are being concentrated, and wasted.

A note about my methodology:
To predict results within the new boundaries, I need to rely on data calculated from previous boundaries.

I am using election data from the amazing folks at openelections.org. I begin with election results at the smallest available unit of geography, the State House Districts. When a district is entirely contained within one of the new Congressional Districts, I simply add the votes. When the state house district is split between two or more of the congressional districts, I allocate its votes based on the 2010 census population-over-age-18 of the overlapping areas. Often, analyses apportion these voters based on area, but I expect using population-weighted measures to be much more accurate. Code available upon request (or once I organize my github repository).

Bob Brady is retiring. Who can win his seat?

US Congressman Bob Brady stunned Philadelphia yesterday when he announced that he would not run for reelection. This puts Congressional District 1, which he has held since 1998, up for grabs. Immediately, the scramble among Democrats to pursue the seat began.

In November, the seat will almost certainly be won by the Democrat. But who can win the Democratic Primary in May? Is the district ripe for pick-up by a progressive change candidate? Or will Brady, who is also president of the Democratic City Committee, be replaced by another Party stalwart?

What should we expect from the district? Where do its votes come from, and what do we know about those voters? Let’s look at some maps. (You can visit my interactive maps, too).

​EDIT: This may obviously all be moot if the district changes in response to the State Supreme Court’s map overturn…

District 1 stretches from Northeast Philadelphia, through South and Southwest Philly, and down into Media. The gerrymandering is obvious: the southeast stretch encompasses Chester and Swarthmore, which get grouped in with Philadelphia in hopes of concentrating Democratic votes and thus wasting them.

The district is a completely safe Democratic seat. Clinton won it in 2016 with 80% of the vote. Below, I’ve aggregated votes to State House districts. Interestingly, the River Wards and parts of South Philly that may be considered Brady’s base were the Trumpiest Democrats, swinging sharply for the Republican.


So the Democrat will almost certainly win in November. But what kind of Democrat will it be? Does the district seem to prefer establishment, Clinton types, or leftist, Sanders types? The voters are actually quite diverse in this regard, combining Black and Hispanic neighborhoods that voted entirely for Clinton in North and West Philly and Chester, with River Wards and South Philly neighborhoods that voted for Sanders. (I continue to find fascinating the overlap between Sanders and Trump voters, suggesting that voters may not have been Left or Right so much as Anti-Clinton. I leave it to you to speculate on the reasons.)

However, the neighborhoods that most strongly supported Clinton are also the neighborhoods that voted the most. A huge majority of the District’s votes come from Center South Philly, North Philly, and Southwest/West Philly. These overlap with some of Clinton’s strongest neighborhoods, especially in Southwest and West Philly.

Since most of the votes come from the city anyway, it’s useful to look at the other competitive Democratic Primary we recently had: the 2017 Philadelphia race for District Attorney. This will exclude the suburban voters in District 1, but they are unlikely to carry the District. Those Center City and South Philly neighborhoods that supported Clinton came out for Larry Krasner one year later, as did the Sanders supporters in the River Wards.
District 1 is racially diverse in a way little of America is. Of course, this top-line diversity does not actually represent neighborhood diversity, but is achieved by aggregating largely segregated neighborhoods. Below is a map of census tract race and ethnicity from the American Community Survey for 2012-16. Hispanic North Philly combines with White South Philly and River Wards and Black West Philly to create a patchwork representation. The map of race also lines up with the gerrymandered carve-outs of the district: District 1 hooks out to include predominately White Fairmount in Brady’s district, while it notably excludes predominately Black Point Breeze.
Brady’s district is predominately poor, typical of the City as a whole. Of course, while the population may be poor, the high-income tracts in Center City are also the places where most of the votes come from, so the average voter is wealthier than the district’s average resident.
What should we expect in May?
A ton of candidates are going to run for the House seat. Whoever wins the Democratic primary is going to win in November. Philadelphia voters constitute the vast majority of the district’s Primary turnout, and Philadelphians will decide the election. Given the neighborhoods that typically vote in primaries, the race will probably be decided by the White voters in Center City, South Philly and the River Wards along with the Black voters in West and Southwest Philly. Those voters split between Clinton and Sanders in 2016, but voted strongly for Krasner in 2017. If a candidate can manage to consolidate the left, especially in a likely high-candidate field, the race should be theirs.